
 Yahoo Finance
 Why NCC Group plc’s (LON:NCC) Use Of Investor Capital Doesn’t Look Great

Today we'll evaluate NCC Group plc (LON:NCC) to determine whether it could have potential as an investment idea. To be precise, we'll consider its Return On Capital Employed (ROCE), as that will inform our view of the quality of the business.
First, we'll go over how we calculate ROCE. Then we'll compare its ROCE to similar companies. And finally, we'll look at how its current liabilities are impacting its ROCE.
What is Return On Capital Employed (ROCE)?
ROCE measures the 'return' (pre-tax profit) a company generates from capital employed in its business. All else being equal, a better business will have a higher ROCE. In brief, it is a useful tool, but it is not without drawbacks. Renowned investment researcher Michael Mauboussin has suggested that a high ROCE can indicate that 'one dollar invested in the company generates value of more than one dollar'.
So, How Do We Calculate ROCE?
Analysts use this formula to calculate return on capital employed:
Return on Capital Employed = Earnings Before Interest and Tax (EBIT) ÷ (Total Assets - Current Liabilities)
Or for NCC Group:
0.086 = UK£24m ÷ (UK£347m - UK£76m) (Based on the trailing twelve months to May 2019.)
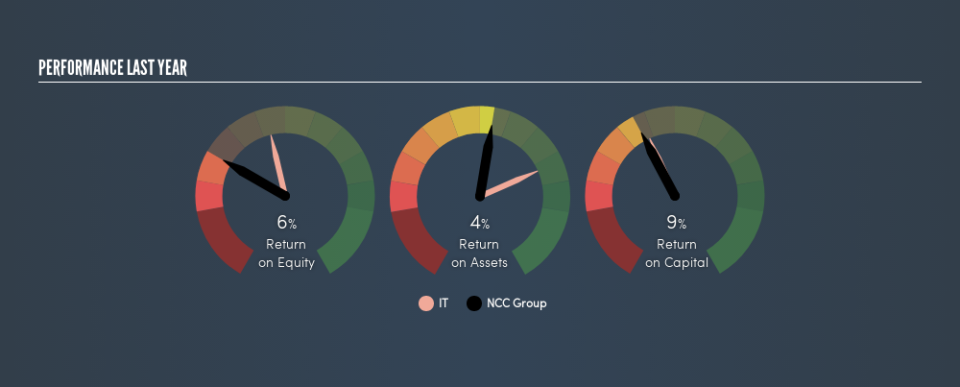
Therefore, NCC Group has an ROCE of 8.6%.
Check out our latest analysis for NCC Group
Is NCC Group's ROCE Good?
One way to assess ROCE is to compare similar companies. We can see NCC Group's ROCE is meaningfully below the IT industry average of 13%. This performance could be negative if sustained, as it suggests the business may underperform its industry. Separate from how NCC Group stacks up against its industry, its ROCE in absolute terms is mediocre; relative to the returns on government bonds. Readers may find more attractive investment prospects elsewhere.
You can click on the image below to see (in greater detail) how NCC Group's past growth compares to other companies.
When considering ROCE, bear in mind that it reflects the past and does not necessarily predict the future. ROCE can be deceptive for cyclical businesses, as returns can look incredible in boom times, and terribly low in downturns. ROCE is, after all, simply a snap shot of a single year. Future performance is what matters, and you can see analyst predictions in our free report on analyst forecasts for the company.
NCC Group's Current Liabilities And Their Impact On Its ROCE
Short term (or current) liabilities, are things like supplier invoices, overdrafts, or tax bills that need to be paid within 12 months. The ROCE equation subtracts current liabilities from capital employed, so a company with a lot of current liabilities appears to have less capital employed, and a higher ROCE than otherwise. To counter this, investors can check if a company has high current liabilities relative to total assets.
NCC Group has total liabilities of UK£76m and total assets of UK£347m. Therefore its current liabilities are equivalent to approximately 22% of its total assets. It is good to see a restrained amount of current liabilities, as this limits the effect on ROCE.
The Bottom Line On NCC Group's ROCE
If NCC Group continues to earn an uninspiring ROCE, there may be better places to invest. Of course, you might find a fantastic investment by looking at a few good candidates. So take a peek at this free list of companies with modest (or no) debt, trading on a P/E below 20.
If you are like me, then you will not want to miss this free list of growing companies that insiders are buying.
We aim to bring you long-term focused research analysis driven by fundamental data. Note that our analysis may not factor in the latest price-sensitive company announcements or qualitative material.
If you spot an error that warrants correction, please contact the editor at editorial-team@simplywallst.com. This article by Simply Wall St is general in nature. It does not constitute a recommendation to buy or sell any stock, and does not take account of your objectives, or your financial situation. Simply Wall St has no position in the stocks mentioned. Thank you for reading.
