
 Yahoo Finance
 Why Is NCI Building (NCS) Up 9.6% Since Its Last Earnings Report?

It has been about a month since the last earnings report for NCI Building Systems, Inc. NCS. Shares have added about 9.6% in that time frame.
Will the recent positive trend continue leading up to its next earnings release, or is NCS due for a pullback? Before we dive into how investors and analysts have reacted as of late, let's take a quick look at its most recent earnings report in order to get a better handle on the important drivers.
NCI Building Q1 Earnings & Revenues Top, View Upbeat
NCI Building Systems delivered adjusted earnings of 14 cents per share for first-quarter fiscal 2018 (ended Jan 28, 2018), which surged nearly three-fold from 5 cents recorded in the prior-year quarter. Earnings also comfortably beat the Zacks Consensus Estimate of 9 cents, by a wide margin of 56%.
Including one-time items, the company reported earnings per share of 8 cents compared with 3 cents a share recorded in the year-ago quarter.
Operational Update
Sales rose 7.6% year over year to $421 million in the quarter. Revenues surpassed the Zacks Consensus Estimate of $404 million as well as management’s guided range of $390-$410 million. This year-over-year growth was driven by continued commercial discipline in the pass-through of higher material costs across all segments, combined with strong volume growth in the Metal Components and Insulated Metal Panels (IMP) segments.
Cost of sales increased 7% year over year to $329.4 million from $307.6 million in the year-ago quarter. Gross profit increased 9.4% year over year to $92 million. Consequently, gross margin expanded 40 basis points (bps) to 21.8% in the quarter, primarily as a result of growth in the IMP segment and favorable commercial discipline, partially offset by elevated transportation costs.
Engineering, selling, general and administrative expenses were up 8.4% to $74.8 million. The company reported adjusted operating income of $19.3 million, which jumped 54% from $12.5 million recorded in the year-ago quarter. Operating margin came in at 4.6%, expanding 140 bps year over year.
Segment Performance
Recently, NCI Building modified its business segments from three reportable divisions to four new segments, in a bid to manage its business by focusing on operating performance and allocating resources. From now, the company will start reporting results under the Engineered Building Systems, Metal Components, IMP and Metal Coil Coating segments.
Revenues at the Engineered Building Systems segment rose 4% to $157 million from $151 million generated in the year-earlier quarter. The segment reported adjusted operating income of $9.6 million, up 14.3% from $8.4 million in the year-ago quarter.
The Metal Component segment’s revenues moved up 9.4% year over year to $146.8 million. On an adjusted basis, operating profit improved 23.6% year over year to $15.7 million.
The IMP segment reported revenues of $110.8 million, up 16.4% year over year. Adjusted operating profit surged significantly to $8.7 million year over year.
The Metal Coil Coating segment reported revenues of $88.3 million, which remained flat year over year. Operating profit dipped 19.4% year over year to $5.4 million.
Financial Update
NCI Building ended the quarter with cash and cash equivalents of $12.4 million compared with $65.7 million reported at the end of the prior-year quarter. The company used $6.6 million of cash in operations in the fiscal first quarter compared with cash usage of $30.4 million in the year-ago quarter. Long-term debt was $387.6 million as of Jan 28, 2018, compared with $387.3 million as of Oct 29, 2017.
NCI Building’s consolidated backlog advanced 8.1% year over year to $570 million at the end of the reported quarter. It repurchased shares for $46.7 million in the fiscal first quarter.
In February 2018, NCI Building entered into a new $415 million secured term loan facility. The company used the proceeds to redeem its existing 8.25% senior notes due 2023, refinance $144 million senior secured term loan and paid related call premiums, fees and expenses. The company also announced the closing of the refinancing of its existing ABL facility with a new $150-million facility.
As a result of these refinancing transactions, NCI Building expects to reduce its current effective cash interest rate from approximately 7% to 3.6%, which represents a reduction in annual interest expense of approximately $12.5 million based on current LIBOR rates. The company expects to record a loss, primarily related to the early extinguishment of the 8.25% senior notes ranging from $23-$25 million during second-quarter fiscal 2018.
In January 2018, NCI Building closed the sale of CENTRIA International LLC, which included the CENTRIA manufacturing facility in China. The company estimates that it will record a loss on the transaction ranging between $6 million and $7.5 million during the fiscal second quarter, of which approximately $3.5-$4 million is considered a non-cash expense.
Outlook
NCI Building remains optimistic about fiscal 2018 supported by bookings and backlog strength as well as encouraging economic indicators. For the fiscal second quarter, the company estimates revenues to be in the range of $430-$450 million and adjusted EBITDA in the band of $29-$39 million.
How Have Estimates Been Moving Since Then?
In the past month, investors have witnessed a downward trend in fresh estimates. There have been two revisions lower for the current quarter. Last month, the consensus estimate has shifted downward by 16.3% due to these changes.
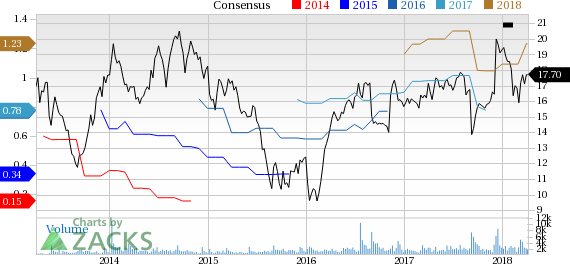
NCI Building Systems, Inc. Price and Consensus
NCI Building Systems, Inc. Price and Consensus | NCI Building Systems, Inc. Quote
VGM Scores
At this time, NCS has a subpar Growth Score of D, however its Momentum is doing a bit better with a C. Following the exact same course, the stock was also allocated a grade of C on the value side, putting it in the middle 20% for this investment strategy.
Overall, the stock has an aggregate VGM Score of D. If you aren't focused on one strategy, this score is the one you should be interested in.
Zacks' style scores indicate that the company's stock is suitable for value and momentum investors.
Outlook
Estimates have been broadly trending downward for the stock and the magnitude of these revisions indicates a downward shift. Notably, NCS has a Zacks Rank #1 (Strong Buy). We expect an above average return from the stock in the next few months.
Want the latest recommendations from Zacks Investment Research? Today, you can download 7 Best Stocks for the Next 30 Days. Click to get this free report
NCI Building Systems, Inc. (NCS) : Free Stock Analysis Report
To read this article on Zacks.com click here.
Zacks Investment Research
