
 Yahoo Finance
 Why NetEnt AB (publ)’s (STO:NET B) Return On Capital Employed Is Impressive

Want to participate in a research study? Help shape the future of investing tools and earn a $60 gift card!
Today we'll look at NetEnt AB (publ) (STO:NET B) and reflect on its potential as an investment. To be precise, we'll consider its Return On Capital Employed (ROCE), as that will inform our view of the quality of the business.
First, we'll go over how we calculate ROCE. Then we'll compare its ROCE to similar companies. Last but not least, we'll look at what impact its current liabilities have on its ROCE.
What is Return On Capital Employed (ROCE)?
ROCE is a metric for evaluating how much pre-tax income (in percentage terms) a company earns on the capital invested in its business. In general, businesses with a higher ROCE are usually better quality. In brief, it is a useful tool, but it is not without drawbacks. Author Edwin Whiting says to be careful when comparing the ROCE of different businesses, since 'No two businesses are exactly alike.'
So, How Do We Calculate ROCE?
The formula for calculating the return on capital employed is:
Return on Capital Employed = Earnings Before Interest and Tax (EBIT) ÷ (Total Assets - Current Liabilities)
Or for NetEnt:
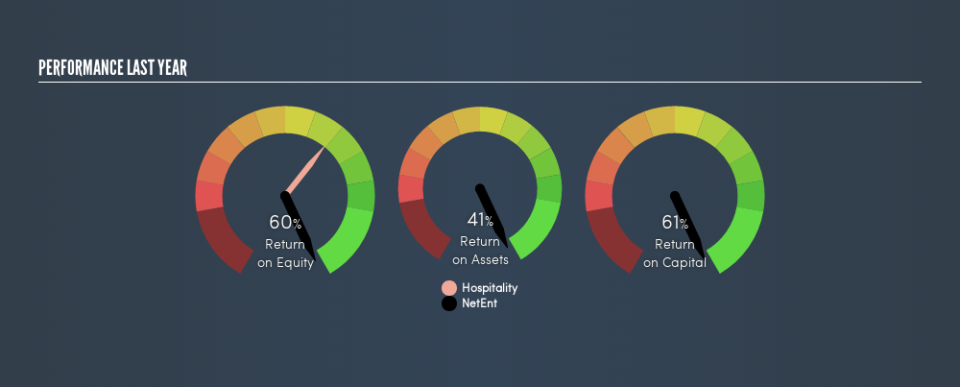
0.61 = kr597m ÷ (kr1.4b - kr378m) (Based on the trailing twelve months to December 2018.)
Therefore, NetEnt has an ROCE of 61%.
View our latest analysis for NetEnt
Is NetEnt's ROCE Good?
One way to assess ROCE is to compare similar companies. NetEnt's ROCE appears to be substantially greater than the 21% average in the Hospitality industry. I think that's good to see, since it implies the company is better than other companies at making the most of its capital. Regardless of the industry comparison, in absolute terms, NetEnt's ROCE currently appears to be excellent.
It is important to remember that ROCE shows past performance, and is not necessarily predictive. ROCE can be misleading for companies in cyclical industries, with returns looking impressive during the boom times, but very weak during the busts. This is because ROCE only looks at one year, instead of considering returns across a whole cycle. What happens in the future is pretty important for investors, so we have prepared a free report on analyst forecasts for NetEnt.
How NetEnt's Current Liabilities Impact Its ROCE
Current liabilities include invoices, such as supplier payments, short-term debt, or a tax bill, that need to be paid within 12 months. Due to the way ROCE is calculated, a high level of current liabilities makes a company look as though it has less capital employed, and thus can (sometimes unfairly) boost the ROCE. To counter this, investors can check if a company has high current liabilities relative to total assets.
NetEnt has total assets of kr1.4b and current liabilities of kr378m. As a result, its current liabilities are equal to approximately 28% of its total assets. The fairly low level of current liabilities won't have much impact on the already great ROCE.
Our Take On NetEnt's ROCE
This is good to see, and with such a high ROCE, NetEnt may be worth a closer look. Of course, you might find a fantastic investment by looking at a few good candidates. So take a peek at this free list of companies with modest (or no) debt, trading on a P/E below 20.
If you are like me, then you will not want to miss this free list of growing companies that insiders are buying.
We aim to bring you long-term focused research analysis driven by fundamental data. Note that our analysis may not factor in the latest price-sensitive company announcements or qualitative material.
If you spot an error that warrants correction, please contact the editor at editorial-team@simplywallst.com. This article by Simply Wall St is general in nature. It does not constitute a recommendation to buy or sell any stock, and does not take account of your objectives, or your financial situation. Simply Wall St has no position in the stocks mentioned. Thank you for reading.
