
 Yahoo Finance
 Why We’re Not Impressed By Devro plc’s (LON:DVO) 9.3% ROCE

Today we’ll evaluate Devro plc (LON:DVO) to determine whether it could have potential as an investment idea. To be precise, we’ll consider its Return On Capital Employed (ROCE), as that will inform our view of the quality of the business.
First up, we’ll look at what ROCE is and how we calculate it. Next, we’ll compare it to others in its industry. Then we’ll determine how its current liabilities are affecting its ROCE.
Understanding Return On Capital Employed (ROCE)
ROCE measures the ‘return’ (pre-tax profit) a company generates from capital employed in its business. In general, businesses with a higher ROCE are usually better quality. In brief, it is a useful tool, but it is not without drawbacks. Author Edwin Whiting says to be careful when comparing the ROCE of different businesses, since ‘No two businesses are exactly alike.’
So, How Do We Calculate ROCE?
The formula for calculating the return on capital employed is:
Return on Capital Employed = Earnings Before Interest and Tax (EBIT) ÷ (Total Assets – Current Liabilities)
Or for Devro:
0.093 = UK£35m ÷ (UK£417m – UK£35m) (Based on the trailing twelve months to June 2018.)
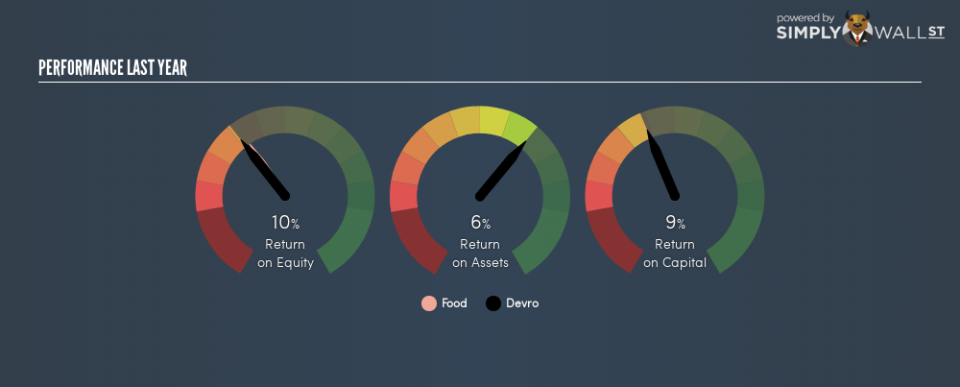
Therefore, Devro has an ROCE of 9.3%.
Check out our latest analysis for Devro
Want to help shape the future of investing tools and platforms? Take the survey and be part of one of the most advanced studies of stock market investors to date.
Is Devro’s ROCE Good?
ROCE is commonly used for comparing the performance of similar businesses. We can see Devro’s ROCE is around the 12% average reported by the Food industry. Separate from how Devro stacks up against its industry, its ROCE in absolute terms is mediocre; relative to the returns on government bonds. It is possible that there are more rewarding investments out there.
When considering this metric, keep in mind that it is backwards looking, and not necessarily predictive. ROCE can be deceptive for cyclical businesses, as returns can look incredible in boom times, and terribly low in downturns. ROCE is only a point-in-time measure. What happens in the future is pretty important for investors, so we have prepared a free report on analyst forecasts for Devro.
What Are Current Liabilities, And How Do They Affect Devro’s ROCE?
Current liabilities are short term bills and invoices that need to be paid in 12 months or less. Due to the way ROCE is calculated, a high level of current liabilities makes a company look as though it has less capital employed, and thus can (sometimes unfairly) boost the ROCE. To counter this, investors can check if a company has high current liabilities relative to total assets.
Devro has total liabilities of UK£35m and total assets of UK£417m. As a result, its current liabilities are equal to approximately 8.4% of its total assets. With low levels of current liabilities, at least Devro’s mediocre ROCE is not unduly boosted.
What We Can Learn From Devro’s ROCE
Devro looks like an ok business, but on this analysis it is not at the top of our buy list. Of course you might be able to find a better stock than Devro. So you may wish to see this free collection of other companies that have grown earnings strongly.
For those who like to find winning investments this free list of growing companies with recent insider purchasing, could be just the ticket.
To help readers see past the short term volatility of the financial market, we aim to bring you a long-term focused research analysis purely driven by fundamental data. Note that our analysis does not factor in the latest price-sensitive company announcements.
The author is an independent contributor and at the time of publication had no position in the stocks mentioned. For errors that warrant correction please contact the editor at editorial-team@simplywallst.com.
