
 Yahoo Finance
 Why We’re Not Impressed By Marston’s PLC’s (LON:MARS) 6.6% ROCE

Today we’ll evaluate Marston’s PLC (LON:MARS) to determine whether it could have potential as an investment idea. Specifically, we’ll consider its Return On Capital Employed (ROCE), since that will give us an insight into how efficiently the business can generate profits from the capital it requires.
First, we’ll go over how we calculate ROCE. Second, we’ll look at its ROCE compared to similar companies. And finally, we’ll look at how its current liabilities are impacting its ROCE.
What is Return On Capital Employed (ROCE)?
ROCE measures the ‘return’ (pre-tax profit) a company generates from capital employed in its business. In general, businesses with a higher ROCE are usually better quality. Overall, it is a valuable metric that has its flaws. Renowned investment researcher Michael Mauboussin has suggested that a high ROCE can indicate that ‘one dollar invested in the company generates value of more than one dollar’.
So, How Do We Calculate ROCE?
Analysts use this formula to calculate return on capital employed:
Return on Capital Employed = Earnings Before Interest and Tax (EBIT) ÷ (Total Assets – Current Liabilities)
Or for Marston’s:
0.066 = UK£173m ÷ (UK£3.0b – UK£446m) (Based on the trailing twelve months to September 2018.)
So, Marston’s has an ROCE of 6.6%.
See our latest analysis for Marston’s
Does Marston’s Have A Good ROCE?
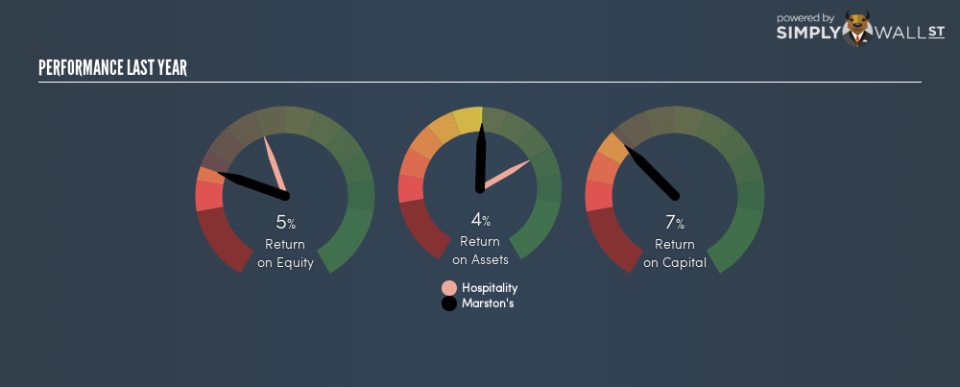
ROCE can be useful when making comparisons, such as between similar companies. In this analysis, Marston’s’s ROCE appears meaningfully below the 8.6% average reported by the Hospitality industry. This performance is not ideal, as it suggests the company may not be deploying its capital as effectively as some competitors. Setting aside the industry comparison for now, Marston’s’s ROCE is mediocre in absolute terms, considering the risk of investing in stocks versus the safety of a bank account. Investors may wish to consider higher-performing investments.
It is important to remember that ROCE shows past performance, and is not necessarily predictive. Companies in cyclical industries can be difficult to understand using ROCE, as returns typically look high during boom times, and low during busts. ROCE is only a point-in-time measure. Since the future is so important for investors, you should check out our free report on analyst forecasts for Marston’s.
How Marston’s’s Current Liabilities Impact Its ROCE
Current liabilities include invoices, such as supplier payments, short-term debt, or a tax bill, that need to be paid within 12 months. The ROCE equation subtracts current liabilities from capital employed, so a company with a lot of current liabilities appears to have less capital employed, and a higher ROCE than otherwise. To counteract this, we check if a company has high current liabilities, relative to its total assets.
Marston’s has total assets of UK£3.0b and current liabilities of UK£446m. As a result, its current liabilities are equal to approximately 15% of its total assets. It is good to see a restrained amount of current liabilities, as this limits the effect on ROCE.
What We Can Learn From Marston’s’s ROCE
With that in mind, we’re not overly impressed with Marston’s’s ROCE, so it may not be the most appealing prospect. But note: Marston’s may not be the best stock to buy. So take a peek at this free list of interesting companies with strong recent earnings growth (and a P/E ratio below 20).
If you are like me, then you will not want to miss this free list of growing companies that insiders are buying.
To help readers see past the short term volatility of the financial market, we aim to bring you a long-term focused research analysis purely driven by fundamental data. Note that our analysis does not factor in the latest price-sensitive company announcements.
The author is an independent contributor and at the time of publication had no position in the stocks mentioned. For errors that warrant correction please contact the editor at editorial-team@simplywallst.com.
