
 Yahoo Finance
 Why We’re Not Keen On Cobham plc’s (LON:COB) 3.9% Return On Capital

Today we’ll look at Cobham plc (LON:COB) and reflect on its potential as an investment. In particular, we’ll consider its Return On Capital Employed (ROCE), as that can give us insight into how profitably the company is able to employ capital in its business.
First up, we’ll look at what ROCE is and how we calculate it. Next, we’ll compare it to others in its industry. Then we’ll determine how its current liabilities are affecting its ROCE.
What is Return On Capital Employed (ROCE)?
ROCE measures the ‘return’ (pre-tax profit) a company generates from capital employed in its business. Generally speaking a higher ROCE is better. Overall, it is a valuable metric that has its flaws. Renowned investment researcher Michael Mauboussin has suggested that a high ROCE can indicate that ‘one dollar invested in the company generates value of more than one dollar’.
How Do You Calculate Return On Capital Employed?
The formula for calculating the return on capital employed is:
Return on Capital Employed = Earnings Before Interest and Tax (EBIT) ÷ (Total Assets – Current Liabilities)
Or for Cobham:
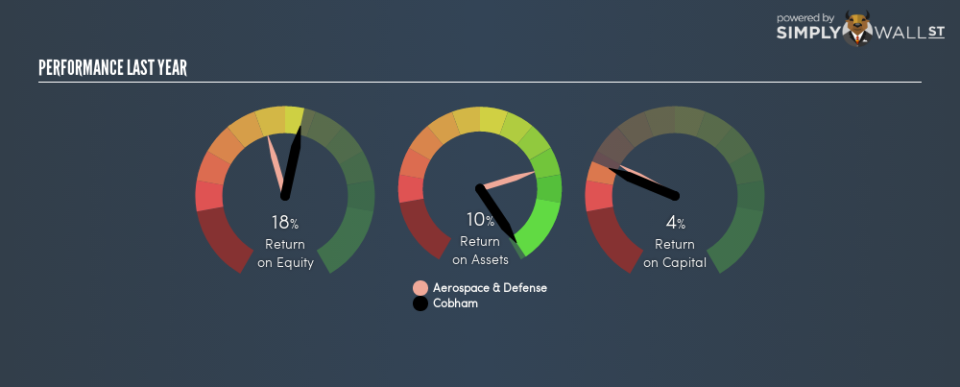
0.039 = UK£77m ÷ (UK£2.5b – UK£735m) (Based on the trailing twelve months to June 2018.)
So, Cobham has an ROCE of 3.9%.
See our latest analysis for Cobham
Does Cobham Have A Good ROCE?
One way to assess ROCE is to compare similar companies. In this analysis, Cobham’s ROCE appears meaningfully below the 11% average reported by the Aerospace & Defense industry. This performance is not ideal, as it suggests the company may not be deploying its capital as effectively as some competitors. Regardless of how Cobham stacks up against its industry, its ROCE in absolute terms is quite low (especially compared to a bank account). It is likely that there are more attractive prospects out there.
When considering ROCE, bear in mind that it reflects the past and does not necessarily predict the future. ROCE can be deceptive for cyclical businesses, as returns can look incredible in boom times, and terribly low in downturns. ROCE is only a point-in-time measure. Future performance is what matters, and you can see analyst predictions in our free report on analyst forecasts for the company.
Cobham’s Current Liabilities And Their Impact On Its ROCE
Liabilities, such as supplier bills and bank overdrafts, are referred to as current liabilities if they need to be paid within 12 months. The ROCE equation subtracts current liabilities from capital employed, so a company with a lot of current liabilities appears to have less capital employed, and a higher ROCE than otherwise. To counteract this, we check if a company has high current liabilities, relative to its total assets.
Cobham has total liabilities of UK£735m and total assets of UK£2.5b. Therefore its current liabilities are equivalent to approximately 29% of its total assets. With a very reasonable level of current liabilities, so the impact on ROCE is fairly minimal.
The Bottom Line On Cobham’s ROCE
Cobham has a poor ROCE, and there may be better investment prospects out there. You might be able to find a better buy than Cobham. If you want a selection of possible winners, check out this free list of interesting companies that trade on a P/E below 20 (but have proven they can grow earnings).
For those who like to find winning investments this free list of growing companies with recent insider purchasing, could be just the ticket.
To help readers see past the short term volatility of the financial market, we aim to bring you a long-term focused research analysis purely driven by fundamental data. Note that our analysis does not factor in the latest price-sensitive company announcements.
The author is an independent contributor and at the time of publication had no position in the stocks mentioned. For errors that warrant correction please contact the editor at editorial-team@simplywallst.com.
