
 Yahoo Finance
 Why Phillips 66's (NYSE:PSX) High P/E Ratio Isn't Necessarily A Bad Thing

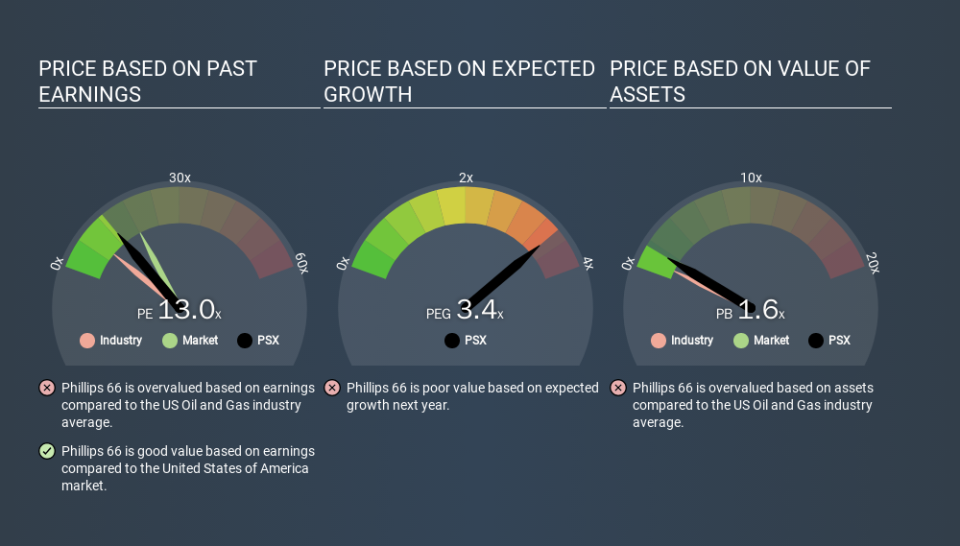
This article is for investors who would like to improve their understanding of price to earnings ratios (P/E ratios). We'll show how you can use Phillips 66's (NYSE:PSX) P/E ratio to inform your assessment of the investment opportunity. Looking at earnings over the last twelve months, Phillips 66 has a P/E ratio of 13.02. In other words, at today's prices, investors are paying $13.02 for every $1 in prior year profit.
See our latest analysis for Phillips 66
How Do I Calculate Phillips 66's Price To Earnings Ratio?
The formula for price to earnings is:
Price to Earnings Ratio = Share Price ÷ Earnings per Share (EPS)
Or for Phillips 66:
P/E of 13.02 = USD88.72 ÷ USD6.81 (Based on the trailing twelve months to December 2019.)
Is A High P/E Ratio Good?
A higher P/E ratio means that investors are paying a higher price for each USD1 of company earnings. That is not a good or a bad thing per se, but a high P/E does imply buyers are optimistic about the future.
Does Phillips 66 Have A Relatively High Or Low P/E For Its Industry?
The P/E ratio indicates whether the market has higher or lower expectations of a company. You can see in the image below that the average P/E (8.4) for companies in the oil and gas industry is lower than Phillips 66's P/E.
Its relatively high P/E ratio indicates that Phillips 66 shareholders think it will perform better than other companies in its industry classification. Clearly the market expects growth, but it isn't guaranteed. So investors should always consider the P/E ratio alongside other factors, such as whether company directors have been buying shares.
How Growth Rates Impact P/E Ratios
Generally speaking the rate of earnings growth has a profound impact on a company's P/E multiple. That's because companies that grow earnings per share quickly will rapidly increase the 'E' in the equation. Therefore, even if you pay a high multiple of earnings now, that multiple will become lower in the future. So while a stock may look expensive based on past earnings, it could be cheap based on future earnings.
Phillips 66 shrunk earnings per share by 43% over the last year. But over the longer term (3 years), earnings per share have increased by 32%.
Remember: P/E Ratios Don't Consider The Balance Sheet
The 'Price' in P/E reflects the market capitalization of the company. Thus, the metric does not reflect cash or debt held by the company. In theory, a company can lower its future P/E ratio by using cash or debt to invest in growth.
Such spending might be good or bad, overall, but the key point here is that you need to look at debt to understand the P/E ratio in context.
Is Debt Impacting Phillips 66's P/E?
Phillips 66 has net debt worth 24% of its market capitalization. This could bring some additional risk, and reduce the number of investment options for management; worth remembering if you compare its P/E to businesses without debt.
The Bottom Line On Phillips 66's P/E Ratio
Phillips 66's P/E is 13.0 which is below average (18.2) in the US market. The debt levels are not a major concern, but the lack of EPS growth is likely weighing on sentiment.
Investors have an opportunity when market expectations about a stock are wrong. If it is underestimating a company, investors can make money by buying and holding the shares until the market corrects itself. So this free visualization of the analyst consensus on future earnings could help you make the right decision about whether to buy, sell, or hold.
Of course, you might find a fantastic investment by looking at a few good candidates. So take a peek at this free list of companies with modest (or no) debt, trading on a P/E below 20.
If you spot an error that warrants correction, please contact the editor at editorial-team@simplywallst.com. This article by Simply Wall St is general in nature. It does not constitute a recommendation to buy or sell any stock, and does not take account of your objectives, or your financial situation. Simply Wall St has no position in the stocks mentioned.
We aim to bring you long-term focused research analysis driven by fundamental data. Note that our analysis may not factor in the latest price-sensitive company announcements or qualitative material. Thank you for reading.
