
 Yahoo Finance
 Why We Like The Returns At Metals Exploration (LON:MTL)
If we want to find a potential multi-bagger, often there are underlying trends that can provide clues. Firstly, we'll want to see a proven return on capital employed (ROCE) that is increasing, and secondly, an expanding base of capital employed. If you see this, it typically means it's a company with a great business model and plenty of profitable reinvestment opportunities. Speaking of which, we noticed some great changes in Metals Exploration's (LON:MTL) returns on capital, so let's have a look.
What is Return On Capital Employed (ROCE)?
If you haven't worked with ROCE before, it measures the 'return' (pre-tax profit) a company generates from capital employed in its business. To calculate this metric for Metals Exploration, this is the formula:
Return on Capital Employed = Earnings Before Interest and Tax (EBIT) ÷ (Total Assets - Current Liabilities)
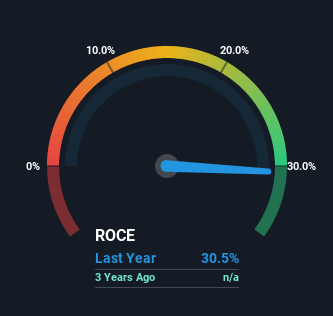
0.31 = US$29m ÷ (US$130m - US$34m) (Based on the trailing twelve months to December 2021).
So, Metals Exploration has an ROCE of 31%. In absolute terms that's a great return and it's even better than the Metals and Mining industry average of 14%.
See our latest analysis for Metals Exploration
Above you can see how the current ROCE for Metals Exploration compares to its prior returns on capital, but there's only so much you can tell from the past. If you're interested, you can view the analysts predictions in our free report on analyst forecasts for the company.
What Can We Tell From Metals Exploration's ROCE Trend?
It's great to see that Metals Exploration has started to generate some pre-tax earnings from prior investments. While the business is profitable now, it used to be incurring losses on invested capital five years ago. In regards to capital employed, Metals Exploration is using 52% less capital than it was five years ago, which on the surface, can indicate that the business has become more efficient at generating these returns. Metals Exploration could be selling under-performing assets since the ROCE is improving.
Our Take On Metals Exploration's ROCE
In the end, Metals Exploration has proven it's capital allocation skills are good with those higher returns from less amount of capital. Although the company may be facing some issues elsewhere since the stock has plunged 74% in the last five years. Still, it's worth doing some further research to see if the trends will continue into the future.
On a final note, we found 3 warning signs for Metals Exploration (1 makes us a bit uncomfortable) you should be aware of.
High returns are a key ingredient to strong performance, so check out our free list ofstocks earning high returns on equity with solid balance sheets.
Have feedback on this article? Concerned about the content? Get in touch with us directly. Alternatively, email editorial-team (at) simplywallst.com.
This article by Simply Wall St is general in nature. We provide commentary based on historical data and analyst forecasts only using an unbiased methodology and our articles are not intended to be financial advice. It does not constitute a recommendation to buy or sell any stock, and does not take account of your objectives, or your financial situation. We aim to bring you long-term focused analysis driven by fundamental data. Note that our analysis may not factor in the latest price-sensitive company announcements or qualitative material. Simply Wall St has no position in any stocks mentioned.
Join A Paid User Research Session
You’ll receive a US$30 Amazon Gift card for 1 hour of your time while helping us build better investing tools for the individual investors like yourself. Sign up here
