
 Yahoo Finance
 Why We Like The Returns At Thryv Holdings (NASDAQ:THRY)
There are a few key trends to look for if we want to identify the next multi-bagger. Amongst other things, we'll want to see two things; firstly, a growing return on capital employed (ROCE) and secondly, an expansion in the company's amount of capital employed. Ultimately, this demonstrates that it's a business that is reinvesting profits at increasing rates of return. With that in mind, the ROCE of Thryv Holdings (NASDAQ:THRY) looks great, so lets see what the trend can tell us.
Return On Capital Employed (ROCE): What Is It?
For those that aren't sure what ROCE is, it measures the amount of pre-tax profits a company can generate from the capital employed in its business. The formula for this calculation on Thryv Holdings is:
Return on Capital Employed = Earnings Before Interest and Tax (EBIT) ÷ (Total Assets - Current Liabilities)
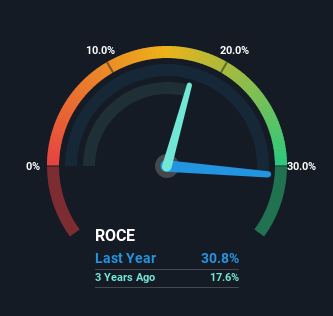
0.31 = US$270m ÷ (US$1.2b - US$300m) (Based on the trailing twelve months to December 2022).
Therefore, Thryv Holdings has an ROCE of 31%. That's a fantastic return and not only that, it outpaces the average of 9.3% earned by companies in a similar industry.
See our latest analysis for Thryv Holdings
In the above chart we have measured Thryv Holdings' prior ROCE against its prior performance, but the future is arguably more important. If you'd like to see what analysts are forecasting going forward, you should check out our free report for Thryv Holdings.
How Are Returns Trending?
It's great to see that Thryv Holdings has started to generate some pre-tax earnings from prior investments. The company was generating losses five years ago, but now it's turned around, earning 31% which is no doubt a relief for some early shareholders. Additionally, the business is utilizing 37% less capital than it was five years ago, and taken at face value, that can mean the company needs less funds at work to get a return. Thryv Holdings could be selling under-performing assets since the ROCE is improving.
In Conclusion...
In the end, Thryv Holdings has proven it's capital allocation skills are good with those higher returns from less amount of capital. Investors may not be impressed by the favorable underlying trends yet because over the last five years the stock has only returned 37% to shareholders. Given that, we'd look further into this stock in case it has more traits that could make it multiply in the long term.
If you'd like to know about the risks facing Thryv Holdings, we've discovered 3 warning signs that you should be aware of.
Thryv Holdings is not the only stock earning high returns. If you'd like to see more, check out our free list of companies earning high returns on equity with solid fundamentals.
Have feedback on this article? Concerned about the content? Get in touch with us directly. Alternatively, email editorial-team (at) simplywallst.com.
This article by Simply Wall St is general in nature. We provide commentary based on historical data and analyst forecasts only using an unbiased methodology and our articles are not intended to be financial advice. It does not constitute a recommendation to buy or sell any stock, and does not take account of your objectives, or your financial situation. We aim to bring you long-term focused analysis driven by fundamental data. Note that our analysis may not factor in the latest price-sensitive company announcements or qualitative material. Simply Wall St has no position in any stocks mentioned.
Join A Paid User Research Session
You’ll receive a US$30 Amazon Gift card for 1 hour of your time while helping us build better investing tools for the individual investors like yourself. Sign up here
