
 Yahoo Finance
 Why SDL plc’s (LON:SDL) High P/E Ratio Isn’t Necessarily A Bad Thing

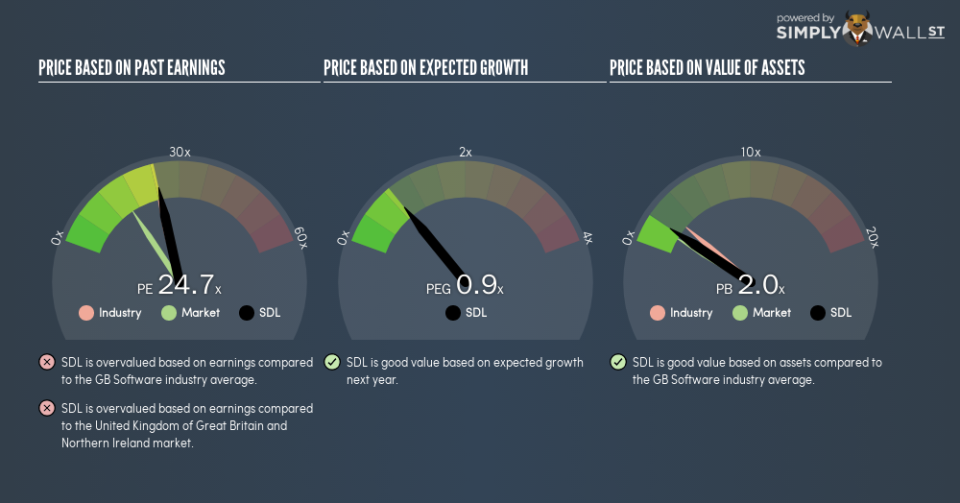
The goal of this article is to teach you how to use price to earnings ratios (P/E ratios). We’ll look at SDL plc’s (LON:SDL) P/E ratio and reflect on what it tells us about the company’s share price. SDL has a price to earnings ratio of 24.67, based on the last twelve months. In other words, at today’s prices, investors are paying £24.67 for every £1 in prior year profit.
View our latest analysis for SDL
How Do I Calculate A Price To Earnings Ratio?
The formula for P/E is:
Price to Earnings Ratio = Price per Share ÷ Earnings per Share (EPS)
Or for SDL:
P/E of 24.67 = £4.62 ÷ £0.19 (Based on the year to June 2018.)
Is A High Price-to-Earnings Ratio Good?
A higher P/E ratio means that investors are paying a higher price for each £1 of company earnings. That isn’t a good or a bad thing on its own, but a high P/E means that buyers have a higher opinion of the business’s prospects, relative to stocks with a lower P/E.
How Growth Rates Impact P/E Ratios
P/E ratios primarily reflect market expectations around earnings growth rates. Earnings growth means that in the future the ‘E’ will be higher. That means even if the current P/E is high, it will reduce over time if the share price stays flat. So while a stock may look expensive based on past earnings, it could be cheap based on future earnings.
SDL increased earnings per share by a whopping 96% last year. And it has bolstered its earnings per share by 49% per year over the last five years. With that performance, I would expect it to have an above average P/E ratio.
How Does SDL’s P/E Ratio Compare To Its Peers?
The P/E ratio essentially measures market expectations of a company. The image below shows that SDL has a P/E ratio that is roughly in line with the software industry average (23.8).
That indicates that the market expects SDL will perform roughly in line with other companies in its industry. So if SDL actually outperforms its peers going forward, that should be a positive for the share price. Checking factors such as the tenure of the board and management could help you form your own view on if that will happen.
Remember: P/E Ratios Don’t Consider The Balance Sheet
It’s important to note that the P/E ratio considers the market capitalization, not the enterprise value. In other words, it does not consider any debt or cash that the company may have on the balance sheet. Theoretically, a business can improve its earnings (and produce a lower P/E in the future), by taking on debt (or spending its remaining cash).
Such expenditure might be good or bad, in the long term, but the point here is that the balance sheet is not reflected by this ratio.
How Does SDL’s Debt Impact Its P/E Ratio?
The extra options and safety that comes with SDL’s UK£23m net cash position means that it deserves a higher P/E than it would if it had a lot of net debt.
The Verdict On SDL’s P/E Ratio
SDL has a P/E of 24.7. That’s higher than the average in the GB market, which is 15.7. Its strong balance sheet gives the company plenty of resources for extra growth, and it has already proven it can grow. Therefore it seems reasonable that the market would have relatively high expectations of the company
Investors should be looking to buy stocks that the market is wrong about. If the reality for a company is better than it expects, you can make money by buying and holding for the long term. So this free report on the analyst consensus forecasts could help you make a master move on this stock.
Of course, you might find a fantastic investment by looking at a few good candidates. So take a peek at this free list of companies with modest (or no) debt, trading on a P/E below 20.
To help readers see past the short term volatility of the financial market, we aim to bring you a long-term focused research analysis purely driven by fundamental data. Note that our analysis does not factor in the latest price-sensitive company announcements.
The author is an independent contributor and at the time of publication had no position in the stocks mentioned. For errors that warrant correction please contact the editor at editorial-team@simplywallst.com.
