
 Yahoo Finance
 Why SDL plc (LON:SDL) Delivered An Inferior ROE Compared To The Industry

I am writing today to help inform people who are new to the stock market and want to learn about Return on Equity using a real-life example.
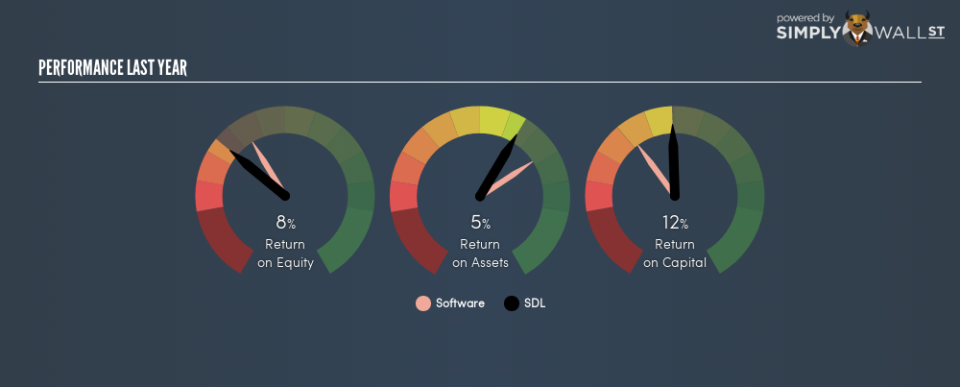
SDL plc (LON:SDL) delivered a less impressive 7.9% ROE over the past year, compared to the 11.0% return generated by its industry. SDL’s results could indicate a relatively inefficient operation to its peers, and while this may be the case, it is important to understand what ROE is made up of and how it should be interpreted. Knowing these components could change your view on SDL’s performance. Metrics such as financial leverage can impact the level of ROE which in turn can affect the sustainability of SDL’s returns. Let me show you what I mean by this.
See our latest analysis for SDL
Breaking down ROE — the mother of all ratios
Return on Equity (ROE) weighs SDL’s profit against the level of its shareholders’ equity. It essentially shows how much the company can generate in earnings given the amount of equity it has raised. While a higher ROE is preferred in most cases, there are several other factors we should consider before drawing any conclusions.
Return on Equity = Net Profit ÷ Shareholders Equity
ROE is measured against cost of equity in order to determine the efficiency of SDL’s equity capital deployed. Its cost of equity is 8.3%. Given a discrepancy of -0.3% between return and cost, this indicated that SDL may be paying more for its capital than what it’s generating in return. ROE can be split up into three useful ratios: net profit margin, asset turnover, and financial leverage. This is called the Dupont Formula:
Dupont Formula
ROE = profit margin × asset turnover × financial leverage
ROE = (annual net profit ÷ sales) × (sales ÷ assets) × (assets ÷ shareholders’ equity)
ROE = annual net profit ÷ shareholders’ equity
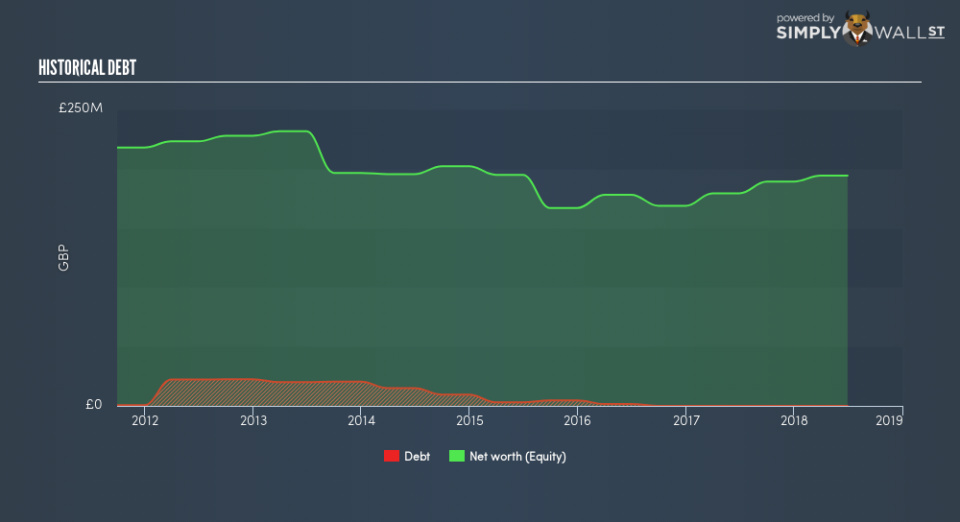
Basically, profit margin measures how much of revenue trickles down into earnings which illustrates how efficient the business is with its cost management. Asset turnover shows how much revenue SDL can generate with its current asset base. Finally, financial leverage will be our main focus today. It shows how much of assets are funded by equity and can show how sustainable the company’s capital structure is. Since ROE can be inflated by excessive debt, we need to examine SDL’s debt-to-equity level. Currently, SDL has no debt which means its returns are driven purely by equity capital. This could explain why SDL’s’ ROE is lower than its industry peers, most of which may have some degree of debt in its business.
Next Steps:
While ROE is a relatively simple calculation, it can be broken down into different ratios, each telling a different story about the strengths and weaknesses of a company. SDL’s below-industry ROE is disappointing, furthermore, its returns were not even high enough to cover its own cost of equity. Although, its appropriate level of leverage means investors can be more confident in the sustainability of SDL’s return with a possible increase should the company decide to increase its debt levels. ROE is a helpful signal, but it is definitely not sufficient on its own to make an investment decision.
For SDL, there are three key factors you should look at:
Financial Health: Does it have a healthy balance sheet? Take a look at our free balance sheet analysis with six simple checks on key factors like leverage and risk.
Valuation: What is SDL worth today? Is the stock undervalued, even when its growth outlook is factored into its intrinsic value? The intrinsic value infographic in our free research report helps visualize whether SDL is currently mispriced by the market.
Other High-Growth Alternatives : Are there other high-growth stocks you could be holding instead of SDL? Explore our interactive list of stocks with large growth potential to get an idea of what else is out there you may be missing!
To help readers see past the short term volatility of the financial market, we aim to bring you a long-term focused research analysis purely driven by fundamental data. Note that our analysis does not factor in the latest price-sensitive company announcements.
The author is an independent contributor and at the time of publication had no position in the stocks mentioned. For errors that warrant correction please contact the editor at editorial-team@simplywallst.com.
