
 Yahoo Finance
 Why Standard Chartered PLC (LON:STAN) May Not Be As Efficient As Its Industry

This article is intended for those of you who are at the beginning of your investing journey and want to better understand how you can grow your money by investing in Standard Chartered PLC (LON:STAN).
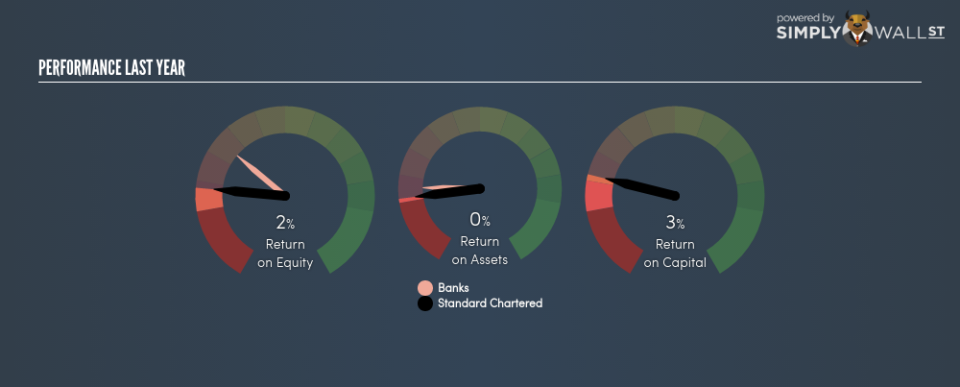
Standard Chartered PLC’s (LON:STAN) most recent return on equity was a substandard 2.45% relative to its industry performance of 7.99% over the past year. Though STAN’s recent performance is underwhelming, it is useful to understand what ROE is made up of and how it should be interpreted. Knowing these components can change your views on STAN’s below-average returns. Today I will look at how components such as financial leverage can influence ROE which may impact the sustainability of STAN’s returns. See our latest analysis for Standard Chartered
What you must know about ROE
Return on Equity (ROE) is a measure of Standard Chartered’s profit relative to its shareholders’ equity. An ROE of 2.45% implies £0.024 returned on every £1 invested. In most cases, a higher ROE is preferred; however, there are many other factors we must consider prior to making any investment decisions.
Return on Equity = Net Profit ÷ Shareholders Equity
Returns are usually compared to costs to measure the efficiency of capital. Standard Chartered’s cost of equity is 8.67%. This means Standard Chartered’s returns actually do not cover its own cost of equity, with a discrepancy of -6.23%. This isn’t sustainable as it implies, very simply, that the company pays more for its capital than what it generates in return. ROE can be broken down into three different ratios: net profit margin, asset turnover, and financial leverage. This is called the Dupont Formula:
Dupont Formula
ROE = profit margin × asset turnover × financial leverage
ROE = (annual net profit ÷ sales) × (sales ÷ assets) × (assets ÷ shareholders’ equity)
ROE = annual net profit ÷ shareholders’ equity
The first component is profit margin, which measures how much of sales is retained after the company pays for all its expenses. Asset turnover reveals how much revenue can be generated from Standard Chartered’s asset base. Finally, financial leverage will be our main focus today. It shows how much of assets are funded by equity and can show how sustainable the company’s capital structure is. Since financial leverage can artificially inflate ROE, we need to look at how much debt Standard Chartered currently has. At over 2.5 times, Standard Chartered’s debt-to-equity ratio is very high and indicates the below-average ROE is already being generated by significant leverage levels.

Next Steps:
While ROE is a relatively simple calculation, it can be broken down into different ratios, each telling a different story about the strengths and weaknesses of a company. Standard Chartered’s ROE is underwhelming relative to the industry average, and its returns were also not strong enough to cover its own cost of equity. Although, its appropriate level of leverage means investors can be more confident in the sustainability of Standard Chartered’s return with a possible increase should the company decide to increase its debt levels. Although ROE can be a useful metric, it is only a small part of diligent research.
For Standard Chartered, there are three key factors you should look at:
Financial Health: Does it have a healthy balance sheet? Take a look at our free balance sheet analysis with six simple checks on key factors like leverage and risk.
Valuation: What is Standard Chartered worth today? Is the stock undervalued, even when its growth outlook is factored into its intrinsic value? The intrinsic value infographic in our free research report helps visualize whether Standard Chartered is currently mispriced by the market.
Other High-Growth Alternatives : Are there other high-growth stocks you could be holding instead of Standard Chartered? Explore our interactive list of stocks with large growth potential to get an idea of what else is out there you may be missing!
To help readers see pass the short term volatility of the financial market, we aim to bring you a long-term focused research analysis purely driven by fundamental data. Note that our analysis does not factor in the latest price sensitive company announcements.
The author is an independent contributor and at the time of publication had no position in the stocks mentioned.
