
 Yahoo Finance
 Why Is Taubman Centers (TCO) Down 1.7% Since its Last Earnings Report?

A month has gone by since the last earnings report for Taubman Centers, Inc. TCO. Shares have lost about 1.7% in that time frame.
Will the recent negative trend continue leading up to its next earnings release, or is TCO due for a breakout? Before we dive into how investors and analysts have reacted as of late, let's take a quick look at its most recent earnings report in order to get a better handle on the important drivers.
Taubman Centers Q1 FFO Beats Estimates, Revenues Down
Taubman Centers reported first-quarter 2018 adjusted FFO per share of $1.04, surpassing the Zacks Consensus Estimate of 92 cents. The figure also came in 13% higher than the year-ago tally of 92 cents.
Adjusted revenues, including minimum rents, overage rents and expense recoveries, for the quarter came in at $141 million, missing the Zacks Consensus Estimate of $144 million. Also, revenues were down nearly 2% from the prior-year quarter.
The quarter experienced higher rents and greater lease cancellation income. Further, cost-saving initiatives executed in the previous year enabled the company to enjoy lower general and administrative expenses.
Quarter in Detail
Comparable center net operating income (NOI) climbed 9.2% for the quarter. Average rent per square foot in comparable centers came in at $57.73, up 3.9% from the prior-year quarter. For the period ended Mar 31, 2018, the trailing 12-month releasing spreads per square foot were 4.4%.
Moreover, comparable center mall tenant sales per square foot rose 12.4% in the reported quarter. Further, the company’s 12-month trailing mall tenant sales per square foot came in at $837, marking a 5% increase.
As of Mar 31, 2018, leased space in comparable centers was 95%. Additionally, ending occupancy in comparable centers was 92.8% on Mar 31, 2018, flat year over year.
Liquidity
Taubman Centers exited the first quarter with cash and cash equivalents of $53.9 million, up from the $42.5 million reported at year-end 2017.
Guidance
The company projects 2018 adjusted FFO per share of $3.72-$3.86, which remained unchanged from the previous outlook.
The full-year FFO per share guidance continues to be backed by assumptions of comparable center NOI growth of about 2-3% for the year. Also, the guidance does not include any future costs that might be incurred related to shareowner activism or fluctuations in the fair value of the SPG common shares investment.
How Have Estimates Been Moving Since Then?
It turns out, fresh estimates have trended downward during the past month. There has been one revision higher for the current quarter compared to three lower.
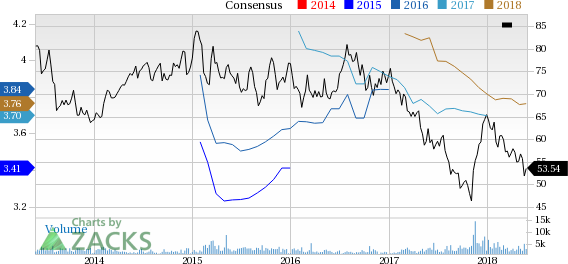
Taubman Centers, Inc. Price and Consensus
Taubman Centers, Inc. Price and Consensus | Taubman Centers, Inc. Quote
VGM Scores
At this time, TCO has a subpar Growth Score of D, however its Momentum is doing a bit better with a C. Charting a somewhat similar path, the stock was also allocated a grade of D on the value side, putting it in the bottom 40% for this investment strategy.
Overall, the stock has an aggregate VGM Score of D. If you aren't focused on one strategy, this score is the one you should be interested in.
The company's stock is suitable solely for momentum based on our styles scores.
Outlook
Estimates have been broadly trending downward for the stock, and the magnitude of these revisions indicates a downward shift. Notably, TCO has a Zacks Rank #3 (Hold). We expect an in-line return from the stock in the next few months.
Want the latest recommendations from Zacks Investment Research? Today, you can download 7 Best Stocks for the Next 30 Days. Click to get this free report
Taubman Centers, Inc. (TCO) : Free Stock Analysis Report
To read this article on Zacks.com click here.
Zacks Investment Research
