
 Yahoo Finance
 Why Is TD Ameritrade (AMTD) Down 1% Since the Last Earnings Report?

A month has gone by since the last earnings report for TD Ameritrade Holding Corporation AMTD. Shares have lost about 1% in that time frame, outperforming the market.
Will the recent negative trend continue leading up to its next earnings release, or is AMTD due for a breakout? Before we dive into how investors and analysts have reacted as of late, let's take a quick look at the most recent earnings report in order to get a better handle on the important catalysts.
TD Ameritrade Q1 Earnings & Revenues Beat Estimates
TD Ameritrade recorded a positive earnings surprise of 56.9% in first-quarter fiscal 2018 (ending Dec 31). The company reported earnings of 80 cents per share, significantly beating the Zacks Consensus Estimate of 51 cents. Moreover, results were up 86% from the prior-year quarter.
The quarter displayed higher revenues and elevated expenses. Rise in net interest margin (NIM) was also recorded. Notably, the company recorded an increase in average client trades per day, indicating improvement in trading activity.
Including certain non-recurring items, net income for the quarter came in at $297 million or 52 cents per share compared with $216 million or 41 cents reported in the prior-year quarter.
Rise in Revenues Offset Escalating Expenses
Net revenues for the quarter came in at $1.26 billion, surpassing the Zacks Consensus Estimate of $1.2 billion. Moreover, net revenues surged 46.3% year over year. The rise was chiefly due to higher transaction-based as well as asset-based revenues.
Total asset-based revenues for the quarter amounted to $790 million, up 61.2% year over year, driven by higher insured deposit account fees, as well as investment product fees and net interest revenues.
Commissions and transaction fees climbed 23.9% from the prior-year quarter to $440 million. Further, the quarter's NIM came in at 1.71%, expanding 39 basis points year over year.
Total operating expenses flared up 82% year over year to $921 million. The rise mainly stemmed from increase in a number of expenses, including employee compensation and benefits, professional services, occupancy and equipment costs, and other expenses.
Trading Activity Improved
Average client trades per day for the reported quarter increased 49% year over year to 726,000.
As of Dec 31, 2017, net new client assets totaled $26.5 billion, up 9% year over year. Total client assets came in at $1.2 trillion, up 48% year over year.
Average spread-based balance was $150.7 billion, jumping 28% year over year, and average fee-based investment balance was up 35% to $230 billion.
Balance Sheet Position
As of Dec 31, 2017, TD Ameritrade’s cash and cash equivalents were $1.6 billion compared with $1.5 billion reported as of Sep 30, 2017. Shareholders’ equity was $7.4 billion compared with $7.2 billion as of Sep 30, 2017.
Outlook
The company updated its outlook for fiscal 2018, which includes projected GAAP earnings of $1.85-$2.45 per share and non-GAAP earnings of $2.55-$3.05 per share. Updated outlook reflects the new U.S. tax legislation.
Management expects to realize synergies of $175-$225 million in fiscal 2018 from the Scottrade acquisition.
Full-year 2018 effective tax rate is expected to be about 22%. Also, in 2019, the company expects tax rate to be 24%.
The company expects certain expenses to increase in second-quarter fiscal 2018, due to incremental investments in advertising incentives and client service personnel to address the high levels of client engagement. Further, it expects expenses to decline in the last two quarters of the fiscal year on the back of clearing conversion.
How Have Estimates Been Moving Since Then?
It turns out, fresh estimates have trended upward during the past month. There have been five revisions higher for the current quarter compared to one lower. While looking back an additional 30 days, we can see even more upward momentum. In the past month, the consensus estimate has shifted by 10.6% due to these changes.
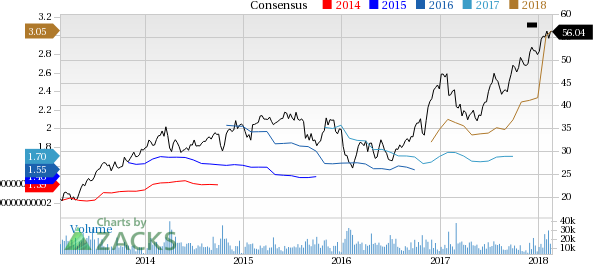
TD Ameritrade Holding Corporation Price and Consensus
TD Ameritrade Holding Corporation Price and Consensus | TD Ameritrade Holding Corporation Quote
VGM Scores
At this time, AMTD has a poor Growth Score of F, however its Momentum is doing a lot better with an A. However, the stock was allocated a grade of F on the value side, putting it in the fifth quintile for this investment strategy.
Overall, the stock has an aggregate VGM Score of F. If you aren't focused on one strategy, this score is the one you should be interested in.
The company's stock is suitable solely for momentum based on our styles scores.
Outlook
Estimates have been broadly trending upward for the stock and the magnitude of these revisions looks promising. It comes with little surprise AMTD has a Zacks Rank # 1(Strong Buy). We expect an above average return from the stock in the next few months.
Want the latest recommendations from Zacks Investment Research? Today, you can download 7 Best Stocks for the Next 30 Days. Click to get this free report
TD Ameritrade Holding Corporation (AMTD) : Free Stock Analysis Report
To read this article on Zacks.com click here.
Zacks Investment Research
