
 Yahoo Finance
 Why U.S. Physical Therapy, Inc.'s (NYSE:USPH) High P/E Ratio Isn't Necessarily A Bad Thing

This article is written for those who want to get better at using price to earnings ratios (P/E ratios). We'll look at U.S. Physical Therapy, Inc.'s (NYSE:USPH) P/E ratio and reflect on what it tells us about the company's share price. U.S. Physical Therapy has a P/E ratio of 52.54, based on the last twelve months. That means that at current prices, buyers pay $52.54 for every $1 in trailing yearly profits.
See our latest analysis for U.S. Physical Therapy
How Do You Calculate A P/E Ratio?
The formula for price to earnings is:
Price to Earnings Ratio = Share Price ÷ Earnings per Share (EPS)
Or for U.S. Physical Therapy:
P/E of 52.54 = USD122.44 ÷ USD2.33 (Based on the year to September 2019.)
Is A High P/E Ratio Good?
A higher P/E ratio means that investors are paying a higher price for each USD1 of company earnings. All else being equal, it's better to pay a low price -- but as Warren Buffett said, 'It's far better to buy a wonderful company at a fair price than a fair company at a wonderful price'.
Does U.S. Physical Therapy Have A Relatively High Or Low P/E For Its Industry?
We can get an indication of market expectations by looking at the P/E ratio. You can see in the image below that the average P/E (25.9) for companies in the healthcare industry is lower than U.S. Physical Therapy's P/E.
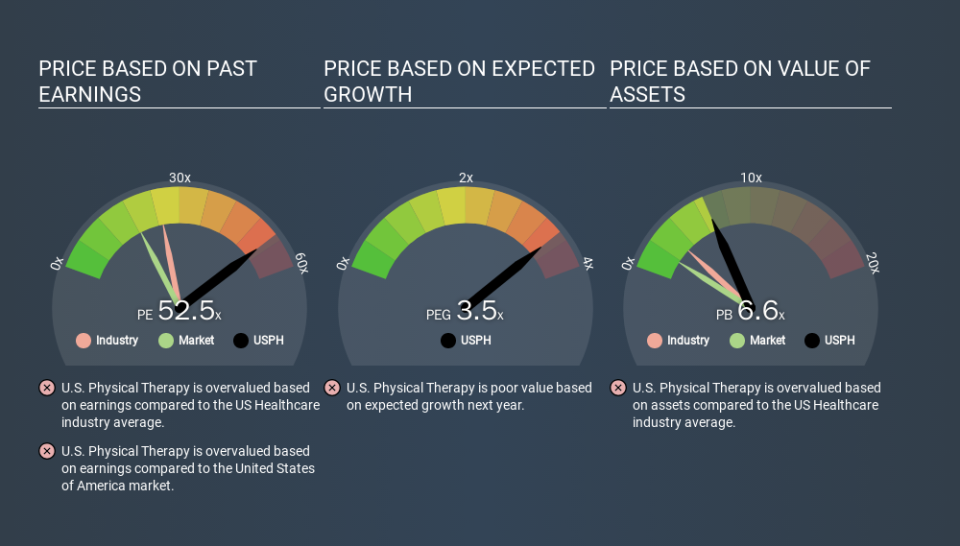
U.S. Physical Therapy's P/E tells us that market participants think the company will perform better than its industry peers, going forward. The market is optimistic about the future, but that doesn't guarantee future growth. So further research is always essential. I often monitor director buying and selling.
How Growth Rates Impact P/E Ratios
Earnings growth rates have a big influence on P/E ratios. Earnings growth means that in the future the 'E' will be higher. Therefore, even if you pay a high multiple of earnings now, that multiple will become lower in the future. So while a stock may look expensive based on past earnings, it could be cheap based on future earnings.
U.S. Physical Therapy's earnings made like a rocket, taking off 61% last year. Having said that, if we look back three years, EPS growth has averaged a comparatively less impressive 13%.
Don't Forget: The P/E Does Not Account For Debt or Bank Deposits
One drawback of using a P/E ratio is that it considers market capitalization, but not the balance sheet. Thus, the metric does not reflect cash or debt held by the company. Hypothetically, a company could reduce its future P/E ratio by spending its cash (or taking on debt) to achieve higher earnings.
Such expenditure might be good or bad, in the long term, but the point here is that the balance sheet is not reflected by this ratio.
U.S. Physical Therapy's Balance Sheet
U.S. Physical Therapy has net debt worth just 1.8% of its market capitalization. It would probably trade on a higher P/E ratio if it had a lot of cash, but I doubt it is having a big impact.
The Bottom Line On U.S. Physical Therapy's P/E Ratio
U.S. Physical Therapy trades on a P/E ratio of 52.5, which is above its market average of 18.4. Its debt levels do not imperil its balance sheet and its EPS growth is very healthy indeed. So to be frank we are not surprised it has a high P/E ratio.
Investors have an opportunity when market expectations about a stock are wrong. If the reality for a company is better than it expects, you can make money by buying and holding for the long term. So this free visualization of the analyst consensus on future earnings could help you make the right decision about whether to buy, sell, or hold.
Of course you might be able to find a better stock than U.S. Physical Therapy. So you may wish to see this free collection of other companies that have grown earnings strongly.
If you spot an error that warrants correction, please contact the editor at editorial-team@simplywallst.com. This article by Simply Wall St is general in nature. It does not constitute a recommendation to buy or sell any stock, and does not take account of your objectives, or your financial situation. Simply Wall St has no position in the stocks mentioned.
We aim to bring you long-term focused research analysis driven by fundamental data. Note that our analysis may not factor in the latest price-sensitive company announcements or qualitative material. Thank you for reading.
