
 Yahoo Finance
 Why Unilever PLC’s (LON:ULVR) Return On Capital Employed Is Impressive

Want to participate in a short research study? Help shape the future of investing tools and you could win a $250 gift card!
Today we are going to look at Unilever PLC (LON:ULVR) to see whether it might be an attractive investment prospect. To be precise, we'll consider its Return On Capital Employed (ROCE), as that will inform our view of the quality of the business.
Firstly, we'll go over how we calculate ROCE. Then we'll compare its ROCE to similar companies. Then we'll determine how its current liabilities are affecting its ROCE.
Return On Capital Employed (ROCE): What is it?
ROCE measures the 'return' (pre-tax profit) a company generates from capital employed in its business. In general, businesses with a higher ROCE are usually better quality. In brief, it is a useful tool, but it is not without drawbacks. Renowned investment researcher Michael Mauboussin has suggested that a high ROCE can indicate that 'one dollar invested in the company generates value of more than one dollar'.
So, How Do We Calculate ROCE?
The formula for calculating the return on capital employed is:
Return on Capital Employed = Earnings Before Interest and Tax (EBIT) ÷ (Total Assets - Current Liabilities)
Or for Unilever:
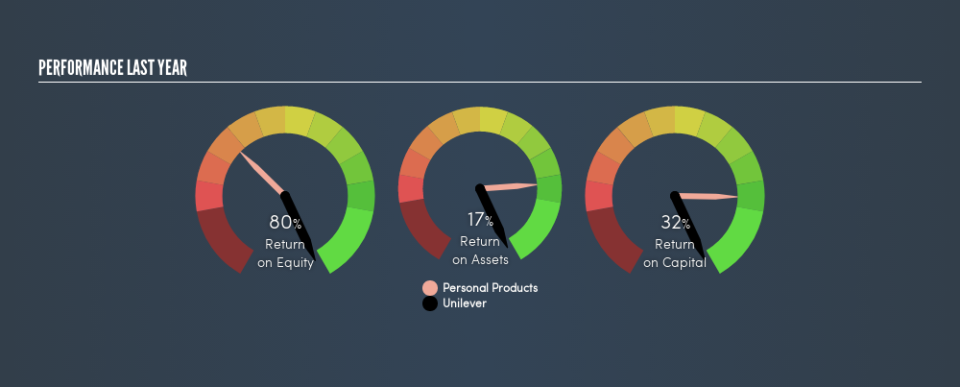
0.32 = €13b ÷ (€59b - €20b) (Based on the trailing twelve months to December 2018.)
So, Unilever has an ROCE of 32%.
View our latest analysis for Unilever
Is Unilever's ROCE Good?
One way to assess ROCE is to compare similar companies. Using our data, we find that Unilever's ROCE is meaningfully better than the 14% average in the Personal Products industry. We would consider this a positive, as it suggests it is using capital more effectively than other similar companies. Regardless of the industry comparison, in absolute terms, Unilever's ROCE currently appears to be excellent.
Our data shows that Unilever currently has an ROCE of 32%, compared to its ROCE of 23% 3 years ago. This makes us wonder if the company is improving. You can see in the image below how Unilever's ROCE compares to its industry. Click to see more on past growth.
Remember that this metric is backwards looking - it shows what has happened in the past, and does not accurately predict the future. Companies in cyclical industries can be difficult to understand using ROCE, as returns typically look high during boom times, and low during busts. This is because ROCE only looks at one year, instead of considering returns across a whole cycle. Since the future is so important for investors, you should check out our free report on analyst forecasts for Unilever.
What Are Current Liabilities, And How Do They Affect Unilever's ROCE?
Current liabilities are short term bills and invoices that need to be paid in 12 months or less. Due to the way the ROCE equation works, having large bills due in the near term can make it look as though a company has less capital employed, and thus a higher ROCE than usual. To counter this, investors can check if a company has high current liabilities relative to total assets.
Unilever has total assets of €59b and current liabilities of €20b. Therefore its current liabilities are equivalent to approximately 33% of its total assets. Unilever's ROCE is boosted somewhat by its middling amount of current liabilities.
Our Take On Unilever's ROCE
Even so, it has a great ROCE, and could be an attractive prospect for further research. Unilever looks strong on this analysis, but there are plenty of other companies that could be a good opportunity . Here is a free list of companies growing earnings rapidly.
If you like to buy stocks alongside management, then you might just love this free list of companies. (Hint: insiders have been buying them).
We aim to bring you long-term focused research analysis driven by fundamental data. Note that our analysis may not factor in the latest price-sensitive company announcements or qualitative material.
If you spot an error that warrants correction, please contact the editor at editorial-team@simplywallst.com. This article by Simply Wall St is general in nature. It does not constitute a recommendation to buy or sell any stock, and does not take account of your objectives, or your financial situation. Simply Wall St has no position in the stocks mentioned. Thank you for reading.
