
 Yahoo Finance
 Why VINCI SA's (EPA:DG) High P/E Ratio Isn't Necessarily A Bad Thing

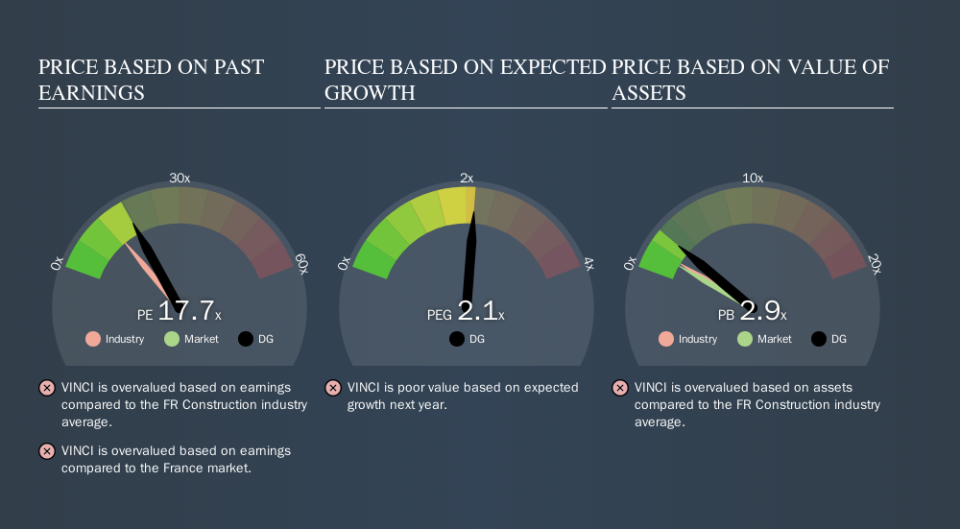
Today, we'll introduce the concept of the P/E ratio for those who are learning about investing. We'll apply a basic P/E ratio analysis to VINCI SA's (EPA:DG), to help you decide if the stock is worth further research. VINCI has a P/E ratio of 17.69, based on the last twelve months. That is equivalent to an earnings yield of about 5.7%.
View our latest analysis for VINCI
How Do You Calculate VINCI's P/E Ratio?
The formula for price to earnings is:
Price to Earnings Ratio = Share Price ÷ Earnings per Share (EPS)
Or for VINCI:
P/E of 17.69 = €97.02 ÷ €5.48 (Based on the year to June 2019.)
Is A High Price-to-Earnings Ratio Good?
A higher P/E ratio means that investors are paying a higher price for each €1 of company earnings. That isn't a good or a bad thing on its own, but a high P/E means that buyers have a higher opinion of the business's prospects, relative to stocks with a lower P/E.
How Does VINCI's P/E Ratio Compare To Its Peers?
One good way to get a quick read on what market participants expect of a company is to look at its P/E ratio. You can see in the image below that the average P/E (13.0) for companies in the construction industry is lower than VINCI's P/E.
Its relatively high P/E ratio indicates that VINCI shareholders think it will perform better than other companies in its industry classification. The market is optimistic about the future, but that doesn't guarantee future growth. So further research is always essential. I often monitor director buying and selling.
How Growth Rates Impact P/E Ratios
Generally speaking the rate of earnings growth has a profound impact on a company's P/E multiple. Earnings growth means that in the future the 'E' will be higher. That means even if the current P/E is high, it will reduce over time if the share price stays flat. And as that P/E ratio drops, the company will look cheap, unless its share price increases.
VINCI had pretty flat EPS growth in the last year. But over the longer term (5 years) earnings per share have increased by 3.6%.
Remember: P/E Ratios Don't Consider The Balance Sheet
One drawback of using a P/E ratio is that it considers market capitalization, but not the balance sheet. Thus, the metric does not reflect cash or debt held by the company. The exact same company would hypothetically deserve a higher P/E ratio if it had a strong balance sheet, than if it had a weak one with lots of debt, because a cashed up company can spend on growth.
Such spending might be good or bad, overall, but the key point here is that you need to look at debt to understand the P/E ratio in context.
So What Does VINCI's Balance Sheet Tell Us?
VINCI's net debt equates to 47% of its market capitalization. While it's worth keeping this in mind, it isn't a worry.
The Bottom Line On VINCI's P/E Ratio
VINCI trades on a P/E ratio of 17.7, which is fairly close to the FR market average of 17.0. When you consider the modest EPS growth last year (along with some debt), it seems the market thinks the growth is sustainable.
Investors should be looking to buy stocks that the market is wrong about. As value investor Benjamin Graham famously said, 'In the short run, the market is a voting machine but in the long run, it is a weighing machine. So this free visual report on analyst forecasts could hold the key to an excellent investment decision.
Of course you might be able to find a better stock than VINCI. So you may wish to see this free collection of other companies that have grown earnings strongly.
We aim to bring you long-term focused research analysis driven by fundamental data. Note that our analysis may not factor in the latest price-sensitive company announcements or qualitative material.
If you spot an error that warrants correction, please contact the editor at editorial-team@simplywallst.com. This article by Simply Wall St is general in nature. It does not constitute a recommendation to buy or sell any stock, and does not take account of your objectives, or your financial situation. Simply Wall St has no position in the stocks mentioned. Thank you for reading.
