
 Yahoo Finance
 Why Water ETFs May Belong In Your Portfolio
Water is a bona fide investment theme, and one that’s gaining traction. The latest ETF to come to market this week, the Tortoise Water Fund (TBLU), was nothing short of another testament to the fact that the business of water is real, and is investable.
As in most physical commodities, the case for investing in water is a simple case of supply and demand imbalances—water supplies are limited, demand is rising. Industry trends and demographic changes are largely to blame for the growing demand for the limited supplies of fresh water.
Today, there are six ETFs offering exposure to water as a business, and thanks to newcomer TBLU, they now range in cost from 0.40% to 0.80%, showing that fee compression is also real, even in highly niche-y corners of the ETF universe.
They are:
PowerShares Water Resources Portfolio (PHO), with $780 million in assets under management and a 0.61% expense ratio
Guggenheim S&P Global Water Index ETF (CGW), with $480 million in AUM and a cost of 0.64%
First Trust Water ETF (FIW), with $251 million in AUM and a cost of 0.57%
PowerShares Global Water Portfolio (PIO), with $185 million in AUM and an expense ratio of 0.76%
Summit Water Infrastructure Multifactor ETF (WTRX) with $4 million in assets and an expense ratio of 0.80%—the costliest; the fund launched last summer
Tortoise Water Fund (TBLU) just launched Feb. 15 with an expense ratio of 0.40% —the cheapest
‘Hydrocommerce’
If you are new to the idea of owning water as part of your broad portfolio, perhaps a way to think about it is similar to precious metal stocks such as miners. Summit Water Capital Advisors describes it in a comprehensive white paper as “hydrocommerce.”
The company’s research into the business of water is compelling. Yes, Summit is behind one of the ETFs in the market today, as well as a hedge fund focused in the space since 1999, so it has skin in the game, but the data are worth a closer look.
Describing the water industry as a “collection of fundamentally different businesses that all have something to do with delivery/treatment of clean water but come from varying economic sectors,” Summit points out that the global water industry is huge—“one of the world’s three largest industry groups in terms of embedded capital, along with oil & gas and electrical power.”
From an investment perspective, the business of water centers on water utility companies and companies that provide services and products to these utilities. ETFs offering exposure to this universe tend to focus heavily on utilities and industrial names. In the U.S. alone, according to Summit, there are upward of 50,000 utilities, “plus their diverse supply chain of technology providers, engineering firms, and heavy equipment manufacturers.”
Return Drivers
Driving returns in this investable universe, simply put, is a growing scarcity of water. Here are some key data points to consider from Summit’s research:
Less than 1% of all water on Earth is fresh, and appropriate for human use, and pollution and industrial waste are destroying “at an alarming rate” that available supply of fresh water.
Global climate change can worsen the outlook for fresh water supplies.
“Unchecked” population growth and growing per-capita demand are increasing pressures on water supply. Estimates have world population at 8.5 billion by 2030, from 7.3 billion now—demand from people is soaring.
Demand for water for agricultural use is also rising as the population grows. According to U.N. statistics, agricultural water use would have to increase by 50% in the next 35 years or so to meet food production demand—a water supply that doesn’t exist.
Demand of water for energy production is also on the rise, and quickly. Energy already takes up about 27% of water usage in the U.S., and that rate is expected to rise another 33% in the next 25 years.
Different ETFs, Different Returns
Here’s an interesting stat: About 25% of the $14 billion invested globally in equity products focused on water is in ETFs, according to Summit. That number is growing, but very little of that is in the U.S. There’s roughly $1.7 billion tied to U.S.-listed water ETFs by our count.
These ETFs are unique in design and exposure. Here are some key differences:
PowerShares Water Resources Portfolio (PHO) focuses exclusively on U.S. companies that create products to conserve and purify water. It’s a U.S. fund that picks securities by market cap, but it then applies a modified liquidity-weighting to its holdings. PHO tilts more toward industrial names—about 64% of the portfolio—and less toward utilities—at 15%. It’s also the most liquid water ETF in the market today. It has some 37 holdings, with an expense ratio of 0.61%.
Guggenheim S&P Global Water Index ETF (CGW) is a market-cap-weighted portfolio of global water utilities, infrastructure and water equipment and materials companies. It’s a broader and more vanilla take on the segment than PHO, with a 46-holding basket. Industrials represent about 48% of the mix, followed by utilities at 28%. CGW costs 0.64% in expense ratio.
First Trust Water ETF (FIW) is U.S.-centric. The fund owns 36 of the largest U.S.-listed water companies, ranked by market cap and weighted equally within five tiers. The weighting scheme gives this ETF a tilt toward smaller-cap names. Industrials also lead here with a 60% allocation, compared to 17% tied to utilities. The ETF costs 0.57% in expense ratio.
PowerShares Global Water Portfolio (PIO) is PHO’s global-in-scope counterpart. The fund emphasizes liquidity of its holdings, as does PHO, by employing a modified liquidity-weighting scheme of water-related companies. Industrials and utilities lead sector allocations at 36% and 30%, respectively, but PIO is relatively concentrated—its top five holdings represent about 35% of the portfolio. PIO also costs more at 0.76% in expense ratio.
Summit Water Infrastructure Multifactor ETF (WTRX) is a fundamentally-weighted portfolio of global companies that derive most of their revenues from water-related businesses. The methodology looks at things like P/E ratios, EBITDA and return on equity. Industrials snag about 45% of the portfolio, while utilities represent about 30%. WTRX, which is less than one year old, costs 0.80% in expense ratio.
Tortoise Water Fund (TBLU), the newcomer in the space, splits the portfolio into two. In one bucket, representing 70% of the mix, are companies that derive at least 50% of their revenues from water-related operations. The other bucket, at 30%, is made up of companies that derive less than half their revenues from water-related activities. The ETF’s tiered approach comes with the cheapest price tag in the segment: 0.40% in expense ratio.
These differences are behind the disparity in these funds’ performances, as the 12-month chart below shows (note WTRX launched last August):
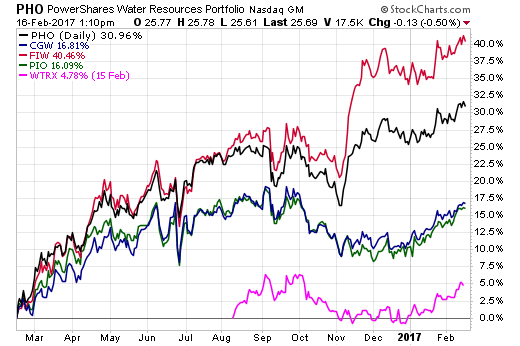
Chart courtesy of StockCharts.com
Water, today, is a growth industry, and one faced with a lot of moving parts in the form of demographic trends, industrial use demands, technology advancements and regulatory changes. Thanks to ETFs, accessing this pocket of the investable universe is easy and increasingly cheap.
Contact Cinthia Murphy at cmurphy@etf.com
Recommended Stories
