
 Yahoo Finance
 Why The Weir Group PLC’s (LON:WEIR) Return On Capital Employed Looks Uninspiring

Today we'll evaluate The Weir Group PLC (LON:WEIR) to determine whether it could have potential as an investment idea. In particular, we'll consider its Return On Capital Employed (ROCE), as that can give us insight into how profitably the company is able to employ capital in its business.
First, we'll go over how we calculate ROCE. Second, we'll look at its ROCE compared to similar companies. Finally, we'll look at how its current liabilities affect its ROCE.
Understanding Return On Capital Employed (ROCE)
ROCE measures the amount of pre-tax profits a company can generate from the capital employed in its business. In general, businesses with a higher ROCE are usually better quality. In brief, it is a useful tool, but it is not without drawbacks. Author Edwin Whiting says to be careful when comparing the ROCE of different businesses, since 'No two businesses are exactly alike.'
So, How Do We Calculate ROCE?
Analysts use this formula to calculate return on capital employed:
Return on Capital Employed = Earnings Before Interest and Tax (EBIT) ÷ (Total Assets - Current Liabilities)
Or for Weir Group:
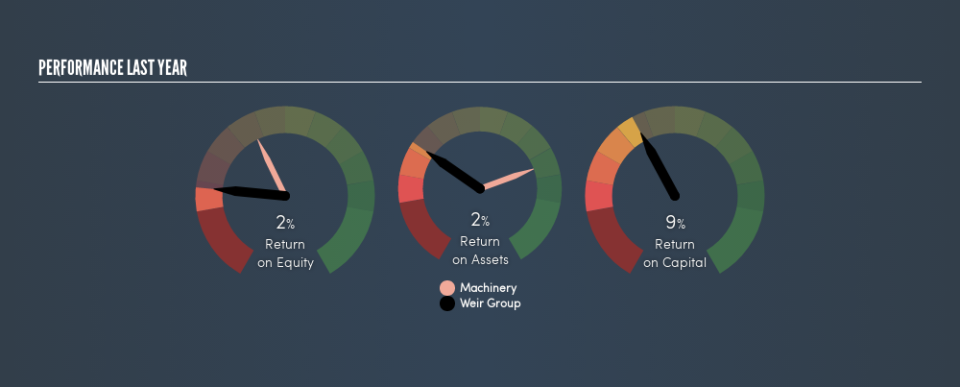
0.086 = UK£275m ÷ (UK£4.7b - UK£1.5b) (Based on the trailing twelve months to December 2018.)
Therefore, Weir Group has an ROCE of 8.6%.
See our latest analysis for Weir Group
Does Weir Group Have A Good ROCE?
One way to assess ROCE is to compare similar companies. We can see Weir Group's ROCE is meaningfully below the Machinery industry average of 13%. This performance could be negative if sustained, as it suggests the business may underperform its industry. Aside from the industry comparison, Weir Group's ROCE is mediocre in absolute terms, considering the risk of investing in stocks versus the safety of a bank account. Investors may wish to consider higher-performing investments.
When considering this metric, keep in mind that it is backwards looking, and not necessarily predictive. Companies in cyclical industries can be difficult to understand using ROCE, as returns typically look high during boom times, and low during busts. ROCE is, after all, simply a snap shot of a single year. Future performance is what matters, and you can see analyst predictions in our free report on analyst forecasts for the company.
Weir Group's Current Liabilities And Their Impact On Its ROCE
Current liabilities are short term bills and invoices that need to be paid in 12 months or less. Due to the way ROCE is calculated, a high level of current liabilities makes a company look as though it has less capital employed, and thus can (sometimes unfairly) boost the ROCE. To counteract this, we check if a company has high current liabilities, relative to its total assets.
Weir Group has total assets of UK£4.7b and current liabilities of UK£1.5b. As a result, its current liabilities are equal to approximately 33% of its total assets. Weir Group has a medium level of current liabilities, which would boost its ROCE somewhat.
What We Can Learn From Weir Group's ROCE
Unfortunately, its ROCE is still uninspiring, and there are potentially more attractive prospects out there. Of course, you might also be able to find a better stock than Weir Group. So you may wish to see this free collection of other companies that have grown earnings strongly.
For those who like to find winning investments this free list of growing companies with recent insider purchasing, could be just the ticket.
We aim to bring you long-term focused research analysis driven by fundamental data. Note that our analysis may not factor in the latest price-sensitive company announcements or qualitative material.
If you spot an error that warrants correction, please contact the editor at editorial-team@simplywallst.com. This article by Simply Wall St is general in nature. It does not constitute a recommendation to buy or sell any stock, and does not take account of your objectives, or your financial situation. Simply Wall St has no position in the stocks mentioned. Thank you for reading.
