
 Yahoo Finance
 Why Young & Co’s Brewery P.L.C. (LON:YNGA) Delivered An Inferior ROE Compared To The Industry

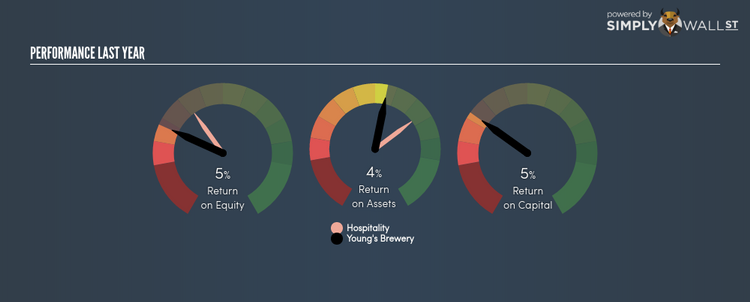
Young & Co’s Brewery P.L.C. (AIM:YNGA) generated a below-average return on equity of 5.48% in the past 12 months, while its industry returned 10.31%. Though YNGA’s recent performance is underwhelming, it is useful to understand what ROE is made up of and how it should be interpreted. Knowing these components can change your views on YNGA’s below-average returns. Today I will look at how components such as financial leverage can influence ROE which may impact the sustainability of YNGA’s returns. Check out our latest analysis for Young’s Brewery
Breaking down ROE — the mother of all ratios
Firstly, Return on Equity, or ROE, is simply the percentage of last years’ earning against the book value of shareholders’ equity. For example, if the company invests £1 in the form of equity, it will generate £0.05 in earnings from this. While a higher ROE is preferred in most cases, there are several other factors we should consider before drawing any conclusions.
Return on Equity = Net Profit ÷ Shareholders Equity
ROE is assessed against cost of equity, which is measured using the Capital Asset Pricing Model (CAPM) – but let’s not dive into the details of that today. For now, let’s just look at the cost of equity number for Young’s Brewery, which is 8.28%. This means Young’s Brewery’s returns actually do not cover its own cost of equity, with a discrepancy of -2.80%. This isn’t sustainable as it implies, very simply, that the company pays more for its capital than what it generates in return. ROE can be dissected into three distinct ratios: net profit margin, asset turnover, and financial leverage. This is called the Dupont Formula:
Dupont Formula
ROE = profit margin × asset turnover × financial leverage
ROE = (annual net profit ÷ sales) × (sales ÷ assets) × (assets ÷ shareholders’ equity)
ROE = annual net profit ÷ shareholders’ equity
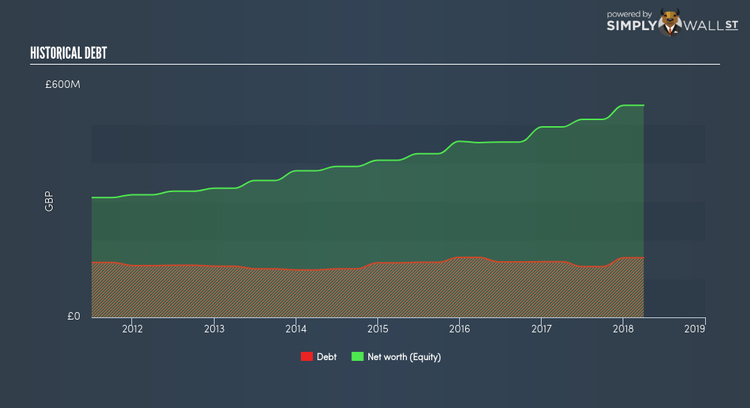
Basically, profit margin measures how much of revenue trickles down into earnings which illustrates how efficient the business is with its cost management. Asset turnover shows how much revenue Young’s Brewery can generate with its current asset base. And finally, financial leverage is simply how much of assets are funded by equity, which exhibits how sustainable the company’s capital structure is. Since ROE can be inflated by excessive debt, we need to examine Young’s Brewery’s debt-to-equity level. Currently the debt-to-equity ratio stands at a low 28.10%, which means Young’s Brewery still has headroom to take on more leverage in order to increase profits.
Next Steps:
ROE is one of many ratios which meaningfully dissects financial statements, which illustrates the quality of a company. Young’s Brewery exhibits a weak ROE against its peers, as well as insufficient levels to cover its own cost of equity this year. Although, its appropriate level of leverage means investors can be more confident in the sustainability of Young’s Brewery’s return with a possible increase should the company decide to increase its debt levels. ROE is a helpful signal, but it is definitely not sufficient on its own to make an investment decision.
For Young’s Brewery, I’ve compiled three pertinent factors you should further examine:
Financial Health: Does it have a healthy balance sheet? Take a look at our free balance sheet analysis with six simple checks on key factors like leverage and risk.
Valuation: What is Young’s Brewery worth today? Is the stock undervalued, even when its growth outlook is factored into its intrinsic value? The intrinsic value infographic in our free research report helps visualize whether Young’s Brewery is currently mispriced by the market.
Other High-Growth Alternatives : Are there other high-growth stocks you could be holding instead of Young’s Brewery? Explore our interactive list of stocks with large growth potential to get an idea of what else is out there you may be missing!
To help readers see pass the short term volatility of the financial market, we aim to bring you a long-term focused research analysis purely driven by fundamental data. Note that our analysis does not factor in the latest price sensitive company announcements.
The author is an independent contributor and at the time of publication had no position in the stocks mentioned.
