
 Yahoo Finance
 Wickes Group (LON:WIX) Is Looking To Continue Growing Its Returns On Capital
What are the early trends we should look for to identify a stock that could multiply in value over the long term? Amongst other things, we'll want to see two things; firstly, a growing return on capital employed (ROCE) and secondly, an expansion in the company's amount of capital employed. Put simply, these types of businesses are compounding machines, meaning they are continually reinvesting their earnings at ever-higher rates of return. Speaking of which, we noticed some great changes in Wickes Group's (LON:WIX) returns on capital, so let's have a look.
Return On Capital Employed (ROCE): What is it?
Just to clarify if you're unsure, ROCE is a metric for evaluating how much pre-tax income (in percentage terms) a company earns on the capital invested in its business. The formula for this calculation on Wickes Group is:
Return on Capital Employed = Earnings Before Interest and Tax (EBIT) ÷ (Total Assets - Current Liabilities)
0.14 = UK£116m ÷ (UK£1.2b - UK£334m) (Based on the trailing twelve months to January 2022).
So, Wickes Group has an ROCE of 14%. In absolute terms, that's a pretty normal return, and it's somewhat close to the Specialty Retail industry average of 17%.
Check out our latest analysis for Wickes Group
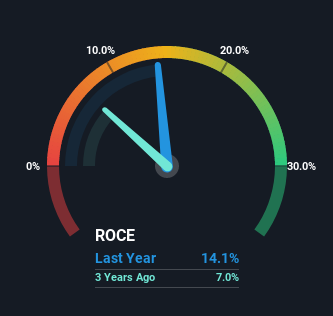
In the above chart we have measured Wickes Group's prior ROCE against its prior performance, but the future is arguably more important. If you'd like to see what analysts are forecasting going forward, you should check out our free report for Wickes Group.
The Trend Of ROCE
You'd find it hard not to be impressed with the ROCE trend at Wickes Group. The data shows that returns on capital have increased by 101% over the trailing three years. That's a very favorable trend because this means that the company is earning more per dollar of capital that's being employed. Interestingly, the business may be becoming more efficient because it's applying 24% less capital than it was three years ago. If this trend continues, the business might be getting more efficient but it's shrinking in terms of total assets.
In another part of our analysis, we noticed that the company's ratio of current liabilities to total assets decreased to 29%, which broadly means the business is relying less on its suppliers or short-term creditors to fund its operations. So this improvement in ROCE has come from the business' underlying economics, which is great to see.
The Bottom Line
In summary, it's great to see that Wickes Group has been able to turn things around and earn higher returns on lower amounts of capital. And since the stock has fallen 24% over the last year, there might be an opportunity here. So researching this company further and determining whether or not these trends will continue seems justified.
If you'd like to know about the risks facing Wickes Group, we've discovered 3 warning signs that you should be aware of.
While Wickes Group may not currently earn the highest returns, we've compiled a list of companies that currently earn more than 25% return on equity. Check out this free list here.
Have feedback on this article? Concerned about the content? Get in touch with us directly. Alternatively, email editorial-team (at) simplywallst.com.
This article by Simply Wall St is general in nature. We provide commentary based on historical data and analyst forecasts only using an unbiased methodology and our articles are not intended to be financial advice. It does not constitute a recommendation to buy or sell any stock, and does not take account of your objectives, or your financial situation. We aim to bring you long-term focused analysis driven by fundamental data. Note that our analysis may not factor in the latest price-sensitive company announcements or qualitative material. Simply Wall St has no position in any stocks mentioned.
