
 Yahoo Finance
 Is Willis Towers Watson Public Limited Company's (NASDAQ:WLTW) High P/E Ratio A Problem For Investors?

This article is written for those who want to get better at using price to earnings ratios (P/E ratios). We'll apply a basic P/E ratio analysis to Willis Towers Watson Public Limited Company's (NASDAQ:WLTW), to help you decide if the stock is worth further research. Willis Towers Watson has a P/E ratio of 29.61, based on the last twelve months. In other words, at today's prices, investors are paying $29.61 for every $1 in prior year profit.
Check out our latest analysis for Willis Towers Watson
How Do You Calculate Willis Towers Watson's P/E Ratio?
The formula for price to earnings is:
Price to Earnings Ratio = Share Price ÷ Earnings per Share (EPS)
Or for Willis Towers Watson:
P/E of 29.61 = $192.93 ÷ $6.52 (Based on the year to June 2019.)
Is A High P/E Ratio Good?
The higher the P/E ratio, the higher the price tag of a business, relative to its trailing earnings. That isn't a good or a bad thing on its own, but a high P/E means that buyers have a higher opinion of the business's prospects, relative to stocks with a lower P/E.
How Does Willis Towers Watson's P/E Ratio Compare To Its Peers?
The P/E ratio essentially measures market expectations of a company. The image below shows that Willis Towers Watson has a higher P/E than the average (15.3) P/E for companies in the insurance industry.
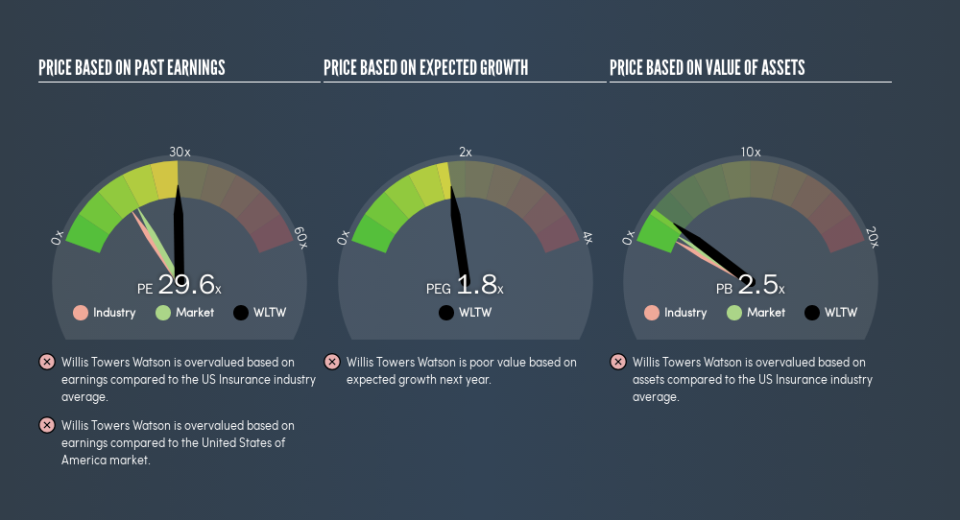
Its relatively high P/E ratio indicates that Willis Towers Watson shareholders think it will perform better than other companies in its industry classification. Clearly the market expects growth, but it isn't guaranteed. So further research is always essential. I often monitor director buying and selling.
How Growth Rates Impact P/E Ratios
P/E ratios primarily reflect market expectations around earnings growth rates. That's because companies that grow earnings per share quickly will rapidly increase the 'E' in the equation. That means even if the current P/E is high, it will reduce over time if the share price stays flat. And as that P/E ratio drops, the company will look cheap, unless its share price increases.
Willis Towers Watson's 87% EPS improvement over the last year was like bamboo growth after rain; rapid and impressive. Even better, EPS is up 18% per year over three years. So we'd absolutely expect it to have a relatively high P/E ratio.
Don't Forget: The P/E Does Not Account For Debt or Bank Deposits
The 'Price' in P/E reflects the market capitalization of the company. In other words, it does not consider any debt or cash that the company may have on the balance sheet. Hypothetically, a company could reduce its future P/E ratio by spending its cash (or taking on debt) to achieve higher earnings.
Such spending might be good or bad, overall, but the key point here is that you need to look at debt to understand the P/E ratio in context.
How Does Willis Towers Watson's Debt Impact Its P/E Ratio?
Willis Towers Watson has net debt worth 15% of its market capitalization. That's enough debt to impact the P/E ratio a little; so keep it in mind if you're comparing it to companies without debt.
The Verdict On Willis Towers Watson's P/E Ratio
Willis Towers Watson's P/E is 29.6 which is above average (17.3) in its market. The company is not overly constrained by its modest debt levels, and its recent EPS growth is nothing short of stand-out. So on this analysis a high P/E ratio seems reasonable.
Investors have an opportunity when market expectations about a stock are wrong. As value investor Benjamin Graham famously said, 'In the short run, the market is a voting machine but in the long run, it is a weighing machine.' So this free report on the analyst consensus forecasts could help you make a master move on this stock.
Of course you might be able to find a better stock than Willis Towers Watson. So you may wish to see this free collection of other companies that have grown earnings strongly.
We aim to bring you long-term focused research analysis driven by fundamental data. Note that our analysis may not factor in the latest price-sensitive company announcements or qualitative material.
If you spot an error that warrants correction, please contact the editor at editorial-team@simplywallst.com. This article by Simply Wall St is general in nature. It does not constitute a recommendation to buy or sell any stock, and does not take account of your objectives, or your financial situation. Simply Wall St has no position in the stocks mentioned. Thank you for reading.
