
 Yahoo Finance
 Wilmington (LON:WIL) Is Investing Its Capital With Increasing Efficiency
To find a multi-bagger stock, what are the underlying trends we should look for in a business? In a perfect world, we'd like to see a company investing more capital into its business and ideally the returns earned from that capital are also increasing. Basically this means that a company has profitable initiatives that it can continue to reinvest in, which is a trait of a compounding machine. Speaking of which, we noticed some great changes in Wilmington's (LON:WIL) returns on capital, so let's have a look.
What Is Return On Capital Employed (ROCE)?
If you haven't worked with ROCE before, it measures the 'return' (pre-tax profit) a company generates from capital employed in its business. Analysts use this formula to calculate it for Wilmington:
Return on Capital Employed = Earnings Before Interest and Tax (EBIT) ÷ (Total Assets - Current Liabilities)
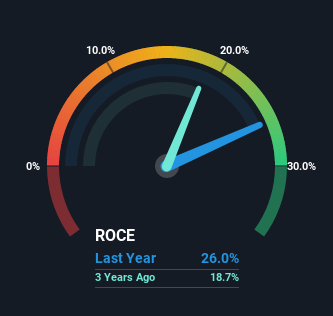
0.26 = UK£20m ÷ (UK£130m - UK£53m) (Based on the trailing twelve months to June 2022).
So, Wilmington has an ROCE of 26%. That's a fantastic return and not only that, it outpaces the average of 15% earned by companies in a similar industry.
Check out our latest analysis for Wilmington
Above you can see how the current ROCE for Wilmington compares to its prior returns on capital, but there's only so much you can tell from the past. If you'd like, you can check out the forecasts from the analysts covering Wilmington here for free.
What The Trend Of ROCE Can Tell Us
Wilmington has not disappointed in regards to ROCE growth. The data shows that returns on capital have increased by 61% over the trailing five years. The company is now earning UK£0.3 per dollar of capital employed. Interestingly, the business may be becoming more efficient because it's applying 28% less capital than it was five years ago. If this trend continues, the business might be getting more efficient but it's shrinking in terms of total assets.
On a side note, Wilmington's current liabilities are still rather high at 40% of total assets. This can bring about some risks because the company is basically operating with a rather large reliance on its suppliers or other sorts of short-term creditors. While it's not necessarily a bad thing, it can be beneficial if this ratio is lower.
The Key Takeaway
In a nutshell, we're pleased to see that Wilmington has been able to generate higher returns from less capital. Since the stock has returned a solid 44% to shareholders over the last five years, it's fair to say investors are beginning to recognize these changes. With that being said, we still think the promising fundamentals mean the company deserves some further due diligence.
If you want to know some of the risks facing Wilmington we've found 2 warning signs (1 shouldn't be ignored!) that you should be aware of before investing here.
If you want to search for more stocks that have been earning high returns, check out this free list of stocks with solid balance sheets that are also earning high returns on equity.
Have feedback on this article? Concerned about the content? Get in touch with us directly. Alternatively, email editorial-team (at) simplywallst.com.
This article by Simply Wall St is general in nature. We provide commentary based on historical data and analyst forecasts only using an unbiased methodology and our articles are not intended to be financial advice. It does not constitute a recommendation to buy or sell any stock, and does not take account of your objectives, or your financial situation. We aim to bring you long-term focused analysis driven by fundamental data. Note that our analysis may not factor in the latest price-sensitive company announcements or qualitative material. Simply Wall St has no position in any stocks mentioned.
Join A Paid User Research Session
You’ll receive a US$30 Amazon Gift card for 1 hour of your time while helping us build better investing tools for the individual investors like yourself. Sign up here
