
 Yahoo Finance
 Woodward (WWD) Down 1.9% Since Earnings Report: Can It Rebound?

It has been about a month since the last earnings report for Woodward, Inc. WWD. Shares have lost about 1.9% in that frame, outperforming the market.
Will the recent negative trend continue leading up to its next earnings release, or is WWD due for a breakout? Before we dive into how investors and analysts have reacted of late, let's take a quick look at its most recent earnings report in order to get a better handle on the important catalysts.
Woodward Beats on Q1 Sales, Lifts 2018 Earnings View
Woodward reported first-quarter fiscal 2018 adjusted earnings of 53 cents per share, which missed the Zacks Consensus Estimate of 60 cents by 11.7%. The bottom line declined 27.4% from the prior-year figure of 73 cents.
Adjusted earnings included a one-time expense of 24 cents per share, courtesy of the latest U.S. tax legislation.
The bottom line was also affected by increased investment in research and development along with the timing of stock compensation expenses.
Total Revenues
Quarterly net sales of $470.1 million surpassed the Zacks Consensus Estimate of $469 million by 0.4%. The top line also increased 6.2% from the year-ago figure of $442.9 million on sales growth at the Aerospace segment.
Operational Update
Woodward’s total costs and expenses increased 9.3% year over year to $432.7 million in the reported quarter. The rise was led by higher cost of goods sold; selling, general, and administrative expenses as well as research and development expenses.
Quarterly Segmental Performance
Aerospace: Revenues were up 14.7% year over year to $305.9 million, owing to increased sales at commercial as well as defense programs.
Earnings totaled $43.6 million, down 7.1% year over year owing to increased investment in research and development for new awards and opportunities being pursued.
Industrial: Revenues totaled $164.2 million, down 6.8% year over year due to significant drop in both large gas turbine and renewable sales.
Meanwhile, the bottom line improved 7.5% to $19.3 million on cost reduction initiatives, partially offset by the impact of lower sales.
Financial Details
As of Dec 31, 2017, cash and cash equivalents were $85.7 million, compared with $87.6 million as of Sep 30, 2017.
Long-term debt (excluding current portion) totaled $583.3 million as of Dec 31, 2017, up from $580.3 million as of Sep 30, 2017.
Free cash outflow was $31 million in the fiscal first quarter compared with $31 million in the year-ago quarter.
In the fiscal first quarter, net cash used in operating activities was $2.5 million, compared with $52.4 million in the prior-year quarter. Also, payments for property, plant and equipment were $28.5 million, compared with $21.1 million a year ago.
Fiscal 2018 Guidance
Woodward maintains net sales guidance at the $2.2-$2.3 billion range for fiscal 2018. Earnings per share are now projected in the band of $3.35-$3.60, compared to the prior range of $3.20-$3.50, reflecting the
anticipated effects of the change in tax legislation.
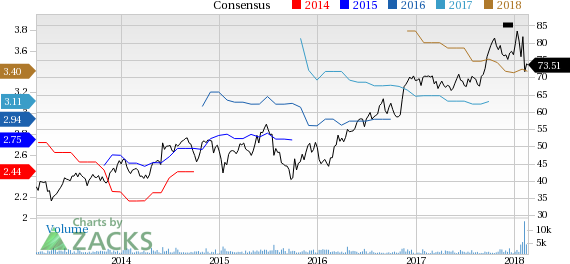
Woodward, Inc. Price and Consensus
Woodward, Inc. Price and Consensus | Woodward, Inc. Quote
How Have Estimates Been Moving Since Then?
In the past month, investors have witnessed an upward trend in fresh estimates. There have been two revisions higher for the current quarter. While looking back an additional 30 days, we can see even more upward momentum. There have been three moves higher in the last two months. In the past month, the consensus estimate has shifted by 7.3% due to these changes.
VGM Scores
At this time, WWD has a poor Growth Score of F, however its Momentum is doing a bit better with a D. Following the exact same course, the stock was allocated a grade of D on the value side, putting it in the bottom 40% for this investment strategy.
Overall, the stock has an aggregate VGM Score of F. If you aren't focused on one strategy, this score is the one you should be interested in.
Our style scores indicate that investors will probably be better served looking elsewhere.
Outlook
Estimates have been trending upward for the stock and the magnitude of these revisions looks promising. Notably, WWD has a Zacks Rank #3 (Hold). We expect in-line returns from the stock in the next few months.
Want the latest recommendations from Zacks Investment Research? Today, you can download 7 Best Stocks for the Next 30 Days. Click to get this free report
Woodward, Inc. (WWD) : Free Stock Analysis Report
To read this article on Zacks.com click here.
