
 Yahoo Finance
 Woodward (WWD) Q3 Earnings & Revenues Beat Estimates, Up Y/Y
Woodward, Inc. WWD reported solid third-quarter fiscal 2019 financial results, wherein both the bottom line and the top line surpassed the respective Zacks Consensus Estimate and increased year over year.
Net Earnings
On a GAAP basis, net earnings for the fiscal third quarter were $66.1 million or $1.02 per share compared with $49.1 million or 77 cents per share in the year-ago quarter. The improvement was primarily due to top-line growth.
Adjusted net earnings came in at $84 million or $1.30 per share compared with $71 million or $1.12 per share in the year-ago quarter. The bottom line beat the Zacks Consensus Estimate by 13 cents.
Woodward, Inc. Price, Consensus and EPS Surprise
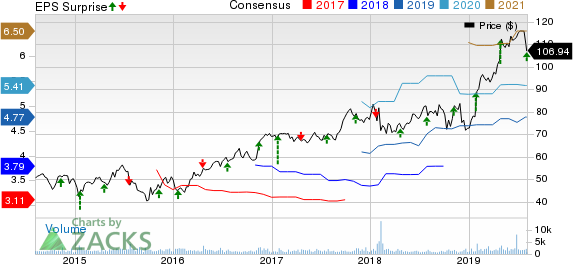
Woodward, Inc. price-consensus-eps-surprise-chart | Woodward, Inc. Quote
Revenues
For the June quarter, net sales increased 27.9% year over year to $752 million, which reflect solid fundamentals in both the segments. The top line surpassed the consensus estimate of $700 million. Organic net sales, which exclude sales attributable to Woodward L’Orange, were $673 million, up 19.5%.
Segment Results
Aerospace: Net sales were up 23.3% year over year to $498.8 million, benefiting from strength across commercial OEM and military markets, however, partly offset by lower commercial aftermarket. Markedly, OEM sales weren’t significantly impacted by the effects of the Boeing 737MAX grounding, although initial provisioning was lower as expected. The segment’s earnings were $103.2 million, up from $83.9 million in the year-ago quarter primarily due to higher sales volume.
Industrial: Net sales totaled $253.2 million, up 38%, in the face of headwinds related to renewables business. This was driven by strong natural gas vehicle sales in China and the addition of Woodward L’Orange. Organic net sales were $175 million, excluding sales of $79 million attributable to Woodward L’Orange. The segment’s earnings increased to $26.2 million from $10.9 million, continuing to benefit from higher sales volume.
Cash Flow & Liquidity
During the first nine months of fiscal 2019, Woodward generated $219.2 million of net cash from operating activities compared with $162.1 million in the prior-year period. For the same period, free cash flow was $141 million compared with $72 million in the year-ago period, primarily driven by increased earnings.
As of Jun 30, 2019, the company had $63.3 million in cash and equivalents with $1,011.1 million of long-term debt (less current portion).
Fiscal 2019 Outlook
Woodward has provided its outlook for fiscal 2019 on the back of strong performance in Aerospace segment and steady improvements in Industrial segment. The company currently expects total net sales of $2.90 billion, with about 19% and 35% rise in Aerospace and Industrial sales, respectively, year over year.
Adjusted earnings per share are anticipated between $4.70 and $4.80, based on around 65 million outstanding shares. While free cash flow is expected to be approximately $300 million, effective tax rate is likely to be 19%.
Zacks Rank & Stocks to Consider
Woodward currently has a Zacks Rank #3 (Hold). A few better-ranked stocks in the broader industry are Thermon Group Holdings, Inc. THR, Comtech Telecommunications Corp. CMTL and Nokia Corp. NOK. While Thermon sports a Zacks Rank #1 (Strong Buy), Comtech and Nokia carry a Zacks Rank #2 (Buy). You can see the complete list of today’s Zacks #1 Rank stocks here.
Thermon surpassed earnings estimates twice in the trailing four quarters, the average positive surprise being 67.4%.
Comtech surpassed earnings estimates in each of the trailing four quarters, the average positive surprise being 216.7%.
Nokia surpassed earnings estimates thrice in the trailing four quarters, the average positive surprise being 89.3%.
The Hottest Tech Mega-Trend of All
Last year, it generated $8 billion in global revenues. By 2020, it's predicted to blast through the roof to $47 billion. Famed investor Mark Cuban says it will produce "the world's first trillionaires," but that should still leave plenty of money for regular investors who make the right trades early.
See Zacks' 3 Best Stocks to Play This Trend >>
Want the latest recommendations from Zacks Investment Research? Today, you can download 7 Best Stocks for the Next 30 Days. Click to get this free report
Comtech Telecommunications Corp. (CMTL) : Free Stock Analysis Report
Nokia Corporation (NOK) : Free Stock Analysis Report
Woodward, Inc. (WWD) : Free Stock Analysis Report
Thermon Group Holdings, Inc. (THR) : Free Stock Analysis Report
To read this article on Zacks.com click here.
Zacks Investment Research
