
 Yahoo Finance
The Worldwide Compressed Natural Gas Industry is Projected to Reach $22.3 Billion by 2030

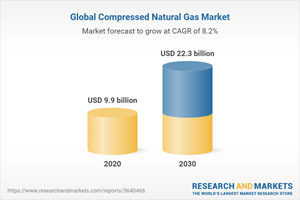
Global Compressed Natural Gas Market
Dublin, Sept. 20, 2022 (GLOBE NEWSWIRE) -- The "Compressed Natural Gas Market By Source, By End User: Global Opportunity Analysis and Industry Forecast, 2020-2030" report has been added to ResearchAndMarkets.com's offering.
The global compressed natural gas market was valued at $9.9 billion in 2020, and is projected to reach $22.3 billion by 2030, growing at a CAGR of 8.2% from 2021 to 2030.
The compressed natural gas (CNG) is used widely in heavy duty transportation vehicles, owing to its properties, including low-cost and eco-friendly nature. Many nations across the globe started using CNG in power production, owing to rise in environmental concerns, including climatic changes and depleting ozone layer. CNG provides effective way for transportation of shorter distance. It is widely used as an alternative for gasoline, diesel, and propane.
Rise in demand for CNG as vehicle fuel across the globe is a key factor driving the growth of the global CNG market during the forecast period. In addition, rise in awareness toward environmental pollution and increase in stringent government regulations toward pollution drive the growth of the global CNG market from 2021 to 2030.
However, high cost associated with initial investment, storage infrastructure & tanks, and installation hamper the growth of the market. Conversely, technological advancements in CNG storage technologies and rapid investment toward building CNG infrastructure are expected to create potential growth opportunity for key players operating in this market.
The global CNG market is segmented on the basis of source, end user, and region. Depending on source, it is categorized into associated gas, non-associated gas, and unconventional sources. According to end user, it is classified into light duty vehicles, medium/heavy duty buses, medium/heavy duty trucks, and others. Region wise, it is analyzed across North America, Europe, Asia-Pacific, and LAMEA.
Key Benefits For Stakeholders
The report includes in-depth analysis of different segments and provides market estimations between 2021 and 2030.
A comprehensive analysis of the factors that drive and restrict the growth of the global CNG market is provided.
Porter's five forces model illustrates the potency of buyers & sellers, which is estimated to assist the market players to adopt effective strategies.
Estimations and forecast are based on factors impacting the global CNG market growth, in terms of value.
Key market players are profiled to gain an understanding of the strategies adopted by them.
This report provides a detailed analysis of the current trends and future estimations from 2021 to 2030, which helps identify the prevailing market opportunities.
Key Topics Covered:
CHAPTER 1: INTRODUCTION
CHAPTER 2: EXECUTIVE SUMMARY
CHAPTER 3: MARKET OVERVIEW
3.1. Market definition and scope
3.2. Key findings
3.2.1. Top investment pockets
3.3. Porter's five forces analysis
3.4. Top player positioning
3.5. Market dynamics
3.5.1. Drivers
3.5.2. Restraints
3.5.3. Opportunities
3.6. COVID-19 Impact Analysis on the market
3.7. Value Chain Analysis
3.8. Key Regulation Analysis
3.9. Patent Landscape
CHAPTER 4: COMPRESSED NATURAL GAS MARKET, BY SOURCE
4.1 Overview
4.1.1 Market size and forecast
4.2 Associated Gas
4.2.1 Key market trends, growth factors and opportunities
4.2.2 Market size and forecast, by region
4.2.3 Market analysis by country
4.3 Non Associated Gas
4.3.1 Key market trends, growth factors and opportunities
4.3.2 Market size and forecast, by region
4.3.3 Market analysis by country
4.4 Unconventional Sources
4.4.1 Key market trends, growth factors and opportunities
4.4.2 Market size and forecast, by region
4.4.3 Market analysis by country
CHAPTER 5: COMPRESSED NATURAL GAS MARKET, BY END USER
5.1 Overview
5.1.1 Market size and forecast
5.2 Light Duty Vehicles
5.2.1 Key market trends, growth factors and opportunities
5.2.2 Market size and forecast, by region
5.2.3 Market analysis by country
5.3 Medium Or Heavy Duty Buses
5.3.1 Key market trends, growth factors and opportunities
5.3.2 Market size and forecast, by region
5.3.3 Market analysis by country
5.4 Medium Or Heavy Duty Trucks
5.4.1 Key market trends, growth factors and opportunities
5.4.2 Market size and forecast, by region
5.4.3 Market analysis by country
CHAPTER 6: COMPRESSED NATURAL GAS MARKET, BY REGION
CHAPTER 7: COMPANY LANDSCAPE
7.1. Introduction
7.2. Top winning strategies
7.3. Product Mapping of Top 10 Player
7.4. Competitive Dashboard
7.5. Competitive Heatmap
7.6. Key developments
CHAPTER 8: COMPANY PROFILES
8.1 Chevron Corporation
8.1.1 Company overview
8.1.2 Company snapshot
8.1.3 Operating business segments
8.1.4 Product portfolio
8.1.5 Business performance
8.1.6 Key strategic moves and developments
8.2 Royal Dutch Shell Plc
8.2.1 Company overview
8.2.2 Company snapshot
8.2.3 Operating business segments
8.2.4 Product portfolio
8.2.5 Business performance
8.2.6 Key strategic moves and developments
8.3 JW Power Company
8.3.1 Company overview
8.3.2 Company snapshot
8.3.3 Operating business segments
8.3.4 Product portfolio
8.3.5 Business performance
8.3.6 Key strategic moves and developments
8.4 Indraprastha Gas Limited
8.4.1 Company overview
8.4.2 Company snapshot
8.4.3 Operating business segments
8.4.4 Product portfolio
8.4.5 Business performance
8.4.6 Key strategic moves and developments
8.5 Eni
8.5.1 Company overview
8.5.2 Company snapshot
8.5.3 Operating business segments
8.5.4 Product portfolio
8.5.5 Business performance
8.5.6 Key strategic moves and developments
8.6 Trillium Energy
8.6.1 Company overview
8.6.2 Company snapshot
8.6.3 Operating business segments
8.6.4 Product portfolio
8.6.5 Business performance
8.6.6 Key strategic moves and developments
8.7 Total Energies
8.7.1 Company overview
8.7.2 Company snapshot
8.7.3 Operating business segments
8.7.4 Product portfolio
8.7.5 Business performance
8.7.6 Key strategic moves and developments
8.8 Occidental Petroleum Corporation
8.8.1 Company overview
8.8.2 Company snapshot
8.8.3 Operating business segments
8.8.4 Product portfolio
8.8.5 Business performance
8.8.6 Key strategic moves and developments
8.9 Phillips 66 Company
8.9.1 Company overview
8.9.2 Company snapshot
8.9.3 Operating business segments
8.9.4 Product portfolio
8.9.5 Business performance
8.9.6 Key strategic moves and developments
8.10 EOG Resources, Inc.
8.10.1 Company overview
8.10.2 Company snapshot
8.10.3 Operating business segments
8.10.4 Product portfolio
8.10.5 Business performance
8.10.6 Key strategic moves and development
For more information about this report visit https://www.researchandmarkets.com/r/rmojxn
Attachment
CONTACT: CONTACT: ResearchAndMarkets.com Laura Wood,Senior Press Manager press@researchandmarkets.com For E.S.T Office Hours Call 1-917-300-0470 For U.S./ CAN Toll Free Call 1-800-526-8630 For GMT Office Hours Call +353-1-416-8900

