
 Yahoo Finance
 Should We Worry About ASSA ABLOY AB (publ)'s (STO:ASSA B) P/E Ratio?

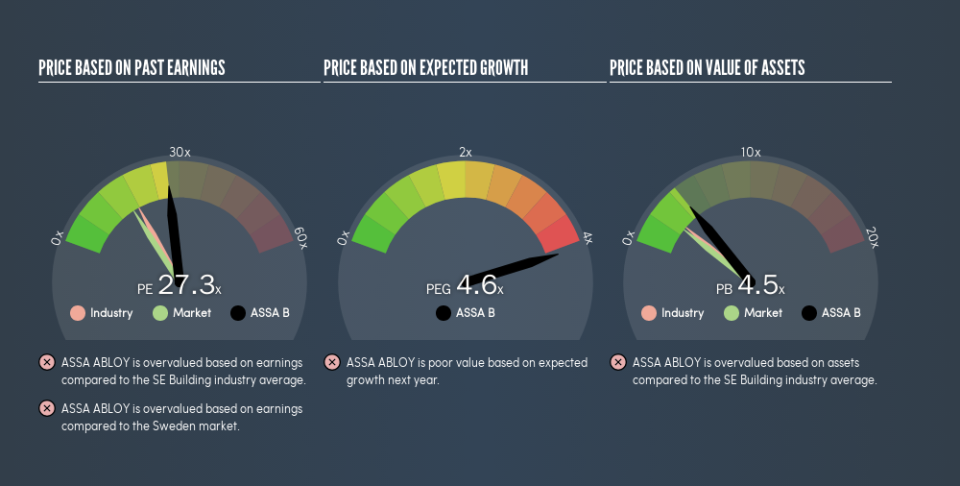
This article is written for those who want to get better at using price to earnings ratios (P/E ratios). We'll show how you can use ASSA ABLOY AB (publ)'s (STO:ASSA B) P/E ratio to inform your assessment of the investment opportunity. ASSA ABLOY has a price to earnings ratio of 27.3, based on the last twelve months. That is equivalent to an earnings yield of about 3.7%.
View our latest analysis for ASSA ABLOY
How Do You Calculate ASSA ABLOY's P/E Ratio?
The formula for P/E is:
Price to Earnings Ratio = Price per Share ÷ Earnings per Share (EPS)
Or for ASSA ABLOY:
P/E of 27.3 = SEK216 ÷ SEK7.91 (Based on the year to June 2019.)
Is A High Price-to-Earnings Ratio Good?
A higher P/E ratio means that buyers have to pay a higher price for each SEK1 the company has earned over the last year. That isn't a good or a bad thing on its own, but a high P/E means that buyers have a higher opinion of the business's prospects, relative to stocks with a lower P/E.
Does ASSA ABLOY Have A Relatively High Or Low P/E For Its Industry?
The P/E ratio essentially measures market expectations of a company. The image below shows that ASSA ABLOY has a higher P/E than the average (17.9) P/E for companies in the building industry.
ASSA ABLOY's P/E tells us that market participants think the company will perform better than its industry peers, going forward. The market is optimistic about the future, but that doesn't guarantee future growth. So further research is always essential. I often monitor director buying and selling.
How Growth Rates Impact P/E Ratios
Earnings growth rates have a big influence on P/E ratios. That's because companies that grow earnings per share quickly will rapidly increase the 'E' in the equation. That means even if the current P/E is high, it will reduce over time if the share price stays flat. And as that P/E ratio drops, the company will look cheap, unless its share price increases.
In the last year, ASSA ABLOY grew EPS like Taylor Swift grew her fan base back in 2010; the 168% gain was both fast and well deserved. Having said that, the average EPS growth over the last three years wasn't so good, coming in at 3.9%.
Don't Forget: The P/E Does Not Account For Debt or Bank Deposits
The 'Price' in P/E reflects the market capitalization of the company. That means it doesn't take debt or cash into account. In theory, a company can lower its future P/E ratio by using cash or debt to invest in growth.
While growth expenditure doesn't always pay off, the point is that it is a good option to have; but one that the P/E ratio ignores.
Is Debt Impacting ASSA ABLOY's P/E?
ASSA ABLOY has net debt worth 13% of its market capitalization. This could bring some additional risk, and reduce the number of investment options for management; worth remembering if you compare its P/E to businesses without debt.
The Verdict On ASSA ABLOY's P/E Ratio
ASSA ABLOY's P/E is 27.3 which is above average (16) in its market. Its debt levels do not imperil its balance sheet and its EPS growth is very healthy indeed. So to be frank we are not surprised it has a high P/E ratio.
Investors have an opportunity when market expectations about a stock are wrong. If the reality for a company is better than it expects, you can make money by buying and holding for the long term. So this free visualization of the analyst consensus on future earnings could help you make the right decision about whether to buy, sell, or hold.
But note: ASSA ABLOY may not be the best stock to buy. So take a peek at this free list of interesting companies with strong recent earnings growth (and a P/E ratio below 20).
We aim to bring you long-term focused research analysis driven by fundamental data. Note that our analysis may not factor in the latest price-sensitive company announcements or qualitative material.
If you spot an error that warrants correction, please contact the editor at editorial-team@simplywallst.com. This article by Simply Wall St is general in nature. It does not constitute a recommendation to buy or sell any stock, and does not take account of your objectives, or your financial situation. Simply Wall St has no position in the stocks mentioned. Thank you for reading.
