
 Yahoo Finance
 Should We Worry About Broadridge Financial Solutions, Inc.'s (NYSE:BR) P/E Ratio?

This article is for investors who would like to improve their understanding of price to earnings ratios (P/E ratios). We'll show how you can use Broadridge Financial Solutions, Inc.'s (NYSE:BR) P/E ratio to inform your assessment of the investment opportunity. What is Broadridge Financial Solutions's P/E ratio? Well, based on the last twelve months it is 31.84. In other words, at today's prices, investors are paying $31.84 for every $1 in prior year profit.
View our latest analysis for Broadridge Financial Solutions
How Do You Calculate Broadridge Financial Solutions's P/E Ratio?
The formula for price to earnings is:
Price to Earnings Ratio = Share Price ÷ Earnings per Share (EPS)
Or for Broadridge Financial Solutions:
P/E of 31.84 = $116.690 ÷ $3.665 (Based on the year to December 2019.)
(Note: the above calculation results may not be precise due to rounding.)
Is A High Price-to-Earnings Ratio Good?
The higher the P/E ratio, the higher the price tag of a business, relative to its trailing earnings. That isn't a good or a bad thing on its own, but a high P/E means that buyers have a higher opinion of the business's prospects, relative to stocks with a lower P/E.
Does Broadridge Financial Solutions Have A Relatively High Or Low P/E For Its Industry?
We can get an indication of market expectations by looking at the P/E ratio. The image below shows that Broadridge Financial Solutions has a higher P/E than the average (29.6) P/E for companies in the it industry.
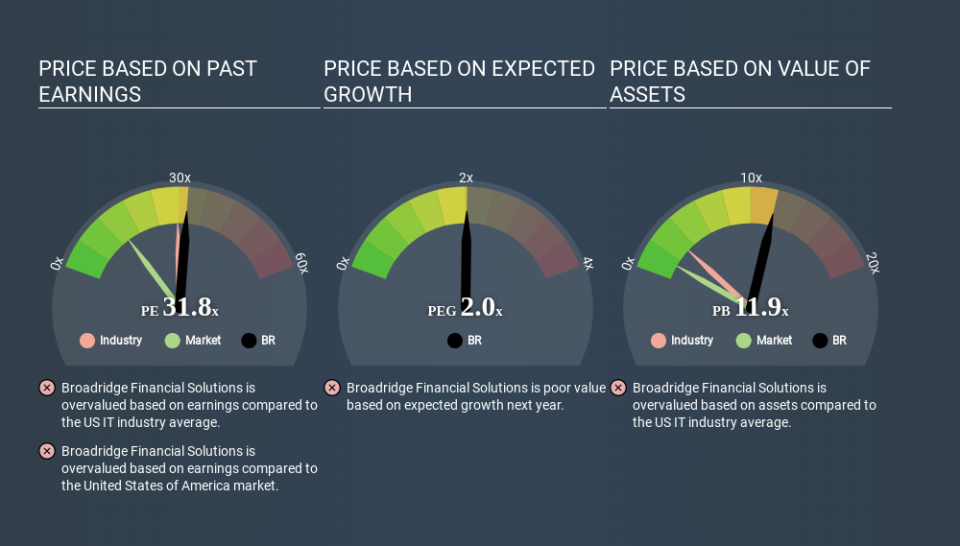
Broadridge Financial Solutions's P/E tells us that market participants think the company will perform better than its industry peers, going forward. The market is optimistic about the future, but that doesn't guarantee future growth. So investors should delve deeper. I like to check if company insiders have been buying or selling.
How Growth Rates Impact P/E Ratios
Earnings growth rates have a big influence on P/E ratios. That's because companies that grow earnings per share quickly will rapidly increase the 'E' in the equation. That means unless the share price increases, the P/E will reduce in a few years. And as that P/E ratio drops, the company will look cheap, unless its share price increases.
Broadridge Financial Solutions saw earnings per share decrease by 3.3% last year. But EPS is up 11% over the last 5 years.
A Limitation: P/E Ratios Ignore Debt and Cash In The Bank
It's important to note that the P/E ratio considers the market capitalization, not the enterprise value. In other words, it does not consider any debt or cash that the company may have on the balance sheet. Theoretically, a business can improve its earnings (and produce a lower P/E in the future) by investing in growth. That means taking on debt (or spending its cash).
Such expenditure might be good or bad, in the long term, but the point here is that the balance sheet is not reflected by this ratio.
Broadridge Financial Solutions's Balance Sheet
Broadridge Financial Solutions has net debt worth 12% of its market capitalization. That's enough debt to impact the P/E ratio a little; so keep it in mind if you're comparing it to companies without debt.
The Verdict On Broadridge Financial Solutions's P/E Ratio
Broadridge Financial Solutions has a P/E of 31.8. That's higher than the average in its market, which is 14.2. With modest debt but no EPS growth in the last year, it's fair to say the P/E implies some optimism about future earnings, from the market.
When the market is wrong about a stock, it gives savvy investors an opportunity. As value investor Benjamin Graham famously said, 'In the short run, the market is a voting machine but in the long run, it is a weighing machine. So this free visual report on analyst forecasts could hold the key to an excellent investment decision.
Of course, you might find a fantastic investment by looking at a few good candidates. So take a peek at this free list of companies with modest (or no) debt, trading on a P/E below 20.
If you spot an error that warrants correction, please contact the editor at editorial-team@simplywallst.com. This article by Simply Wall St is general in nature. It does not constitute a recommendation to buy or sell any stock, and does not take account of your objectives, or your financial situation. Simply Wall St has no position in the stocks mentioned.
We aim to bring you long-term focused research analysis driven by fundamental data. Note that our analysis may not factor in the latest price-sensitive company announcements or qualitative material. Thank you for reading.
