
 Yahoo Finance
 Should We Worry About H & M Hennes & Mauritz AB (publ)'s (STO:HM B) P/E Ratio?

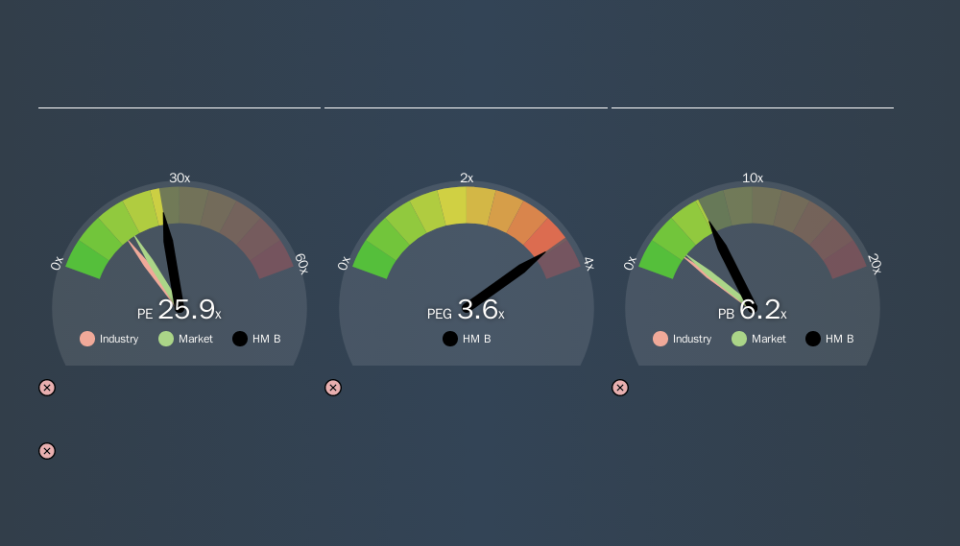
This article is for investors who would like to improve their understanding of price to earnings ratios (P/E ratios). We'll apply a basic P/E ratio analysis to H & M Hennes & Mauritz AB (publ)'s (STO:HM B), to help you decide if the stock is worth further research. Based on the last twelve months, H & M Hennes & Mauritz's P/E ratio is 25.89. In other words, at today's prices, investors are paying SEK25.89 for every SEK1 in prior year profit.
Check out our latest analysis for H & M Hennes & Mauritz
How Do I Calculate H & M Hennes & Mauritz's Price To Earnings Ratio?
The formula for P/E is:
Price to Earnings Ratio = Price per Share ÷ Earnings per Share (EPS)
Or for H & M Hennes & Mauritz:
P/E of 25.89 = SEK199.80 ÷ SEK7.72 (Based on the year to August 2019.)
Is A High Price-to-Earnings Ratio Good?
The higher the P/E ratio, the higher the price tag of a business, relative to its trailing earnings. All else being equal, it's better to pay a low price -- but as Warren Buffett said, 'It's far better to buy a wonderful company at a fair price than a fair company at a wonderful price.
How Does H & M Hennes & Mauritz's P/E Ratio Compare To Its Peers?
One good way to get a quick read on what market participants expect of a company is to look at its P/E ratio. As you can see below, H & M Hennes & Mauritz has a higher P/E than the average company (14.1) in the specialty retail industry.
That means that the market expects H & M Hennes & Mauritz will outperform other companies in its industry. Shareholders are clearly optimistic, but the future is always uncertain. So further research is always essential. I often monitor director buying and selling.
How Growth Rates Impact P/E Ratios
When earnings fall, the 'E' decreases, over time. That means even if the current P/E is low, it will increase over time if the share price stays flat. So while a stock may look cheap based on past earnings, it could be expensive based on future earnings.
H & M Hennes & Mauritz's earnings per share fell by 2.5% in the last twelve months. And over the longer term (5 years) earnings per share have decreased 7.9% annually. So you wouldn't expect a very high P/E.
Remember: P/E Ratios Don't Consider The Balance Sheet
It's important to note that the P/E ratio considers the market capitalization, not the enterprise value. Thus, the metric does not reflect cash or debt held by the company. In theory, a company can lower its future P/E ratio by using cash or debt to invest in growth.
Such spending might be good or bad, overall, but the key point here is that you need to look at debt to understand the P/E ratio in context.
How Does H & M Hennes & Mauritz's Debt Impact Its P/E Ratio?
Net debt totals just 1.8% of H & M Hennes & Mauritz's market cap. So it doesn't have as many options as it would with net cash, but its debt would not have much of an impact on its P/E ratio.
The Verdict On H & M Hennes & Mauritz's P/E Ratio
H & M Hennes & Mauritz has a P/E of 25.9. That's higher than the average in its market, which is 16.5. With modest debt but no EPS growth in the last year, it's fair to say the P/E implies some optimism about future earnings, from the market.
When the market is wrong about a stock, it gives savvy investors an opportunity. If the reality for a company is better than it expects, you can make money by buying and holding for the long term. So this free visual report on analyst forecasts could hold the key to an excellent investment decision.
Of course, you might find a fantastic investment by looking at a few good candidates. So take a peek at this free list of companies with modest (or no) debt, trading on a P/E below 20.
We aim to bring you long-term focused research analysis driven by fundamental data. Note that our analysis may not factor in the latest price-sensitive company announcements or qualitative material.
If you spot an error that warrants correction, please contact the editor at editorial-team@simplywallst.com. This article by Simply Wall St is general in nature. It does not constitute a recommendation to buy or sell any stock, and does not take account of your objectives, or your financial situation. Simply Wall St has no position in the stocks mentioned. Thank you for reading.
