
 Yahoo Finance
 Should You Worry About Marston's PLC's (LON:MARS) CEO Pay?

Want to participate in a short research study? Help shape the future of investing tools and you could win a $250 gift card!
In 1970 Ralph Findlay was appointed CEO of Marston's PLC (LON:MARS). This analysis aims first to contrast CEO compensation with other companies that have similar market capitalization. Next, we'll consider growth that the business demonstrates. Third, we'll reflect on the total return to shareholders over three years, as a second measure of business performance. This method should give us information to assess how appropriately the company pays the CEO.
See our latest analysis for Marston's
How Does Ralph Findlay's Compensation Compare With Similar Sized Companies?
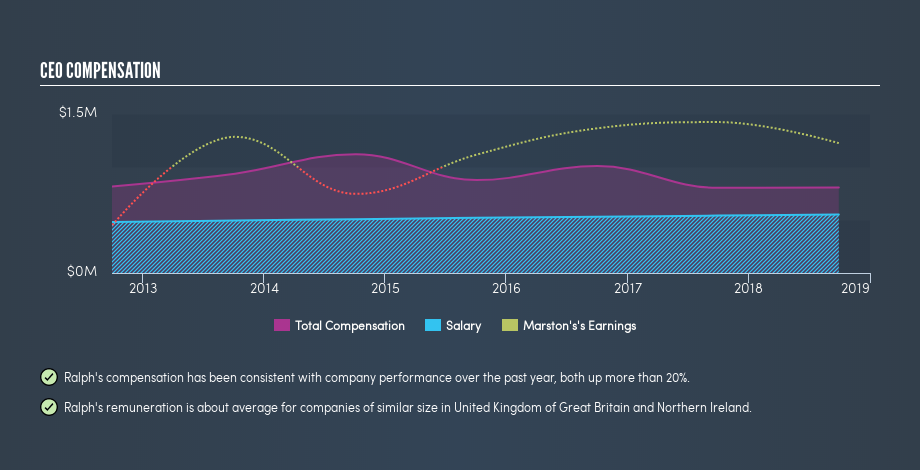
At the time of writing our data says that Marston's PLC has a market cap of UK£681m, and is paying total annual CEO compensation of UK£808k. (This number is for the twelve months until September 2018). While we always look at total compensation first, we note that the salary component is less, at UK£553k. As part of our analysis we looked at companies in the same jurisdiction, with market capitalizations of UK£317m to UK£1.3b. The median total CEO compensation was UK£902k.
So Ralph Findlay is paid around the average of the companies we looked at. While this data point isn't particularly informative alone, it gains more meaning when considered with business performance.
You can see a visual representation of the CEO compensation at Marston's, below.
Is Marston's PLC Growing?
On average over the last three years, Marston's PLC has shrunk earnings per share by 16% each year (measured with a line of best fit). It achieved revenue growth of 7.1% over the last year.
Unfortunately, earnings per share have trended lower over the last three years. And the modest revenue growth over 12 months isn't much comfort against the reduced earnings per share. So given this relatively weak performance, shareholders would probably not want to see high compensation for the CEO. It could be important to check this free visual depiction of what analysts expect for the future.
Has Marston's PLC Been A Good Investment?
With a three year total loss of 14%, Marston's PLC would certainly have some dissatisfied shareholders. So shareholders would probably think the company shouldn't be too generous with CEO compensation.
In Summary...
Remuneration for Ralph Findlay is close enough to the median pay for a CEO of a similar sized company .
The company isn't growing EPS, and shareholder returns have been disappointing. Suffice it to say, we don't think the CEO is underpaid! CEO compensation is one thing, but it is also interesting to check if the CEO is buying or selling Marston's (free visualization of insider trades).
If you want to buy a stock that is better than Marston's, this free list of high return, low debt companies is a great place to look.
We aim to bring you long-term focused research analysis driven by fundamental data. Note that our analysis may not factor in the latest price-sensitive company announcements or qualitative material.
If you spot an error that warrants correction, please contact the editor at editorial-team@simplywallst.com. This article by Simply Wall St is general in nature. It does not constitute a recommendation to buy or sell any stock, and does not take account of your objectives, or your financial situation. Simply Wall St has no position in the stocks mentioned. Thank you for reading.
