
 Yahoo Finance
 Should We Worry About Nu Skin Enterprises, Inc.'s (NYSE:NUS) P/E Ratio?

This article is written for those who want to get better at using price to earnings ratios (P/E ratios). To keep it practical, we'll show how Nu Skin Enterprises, Inc.'s (NYSE:NUS) P/E ratio could help you assess the value on offer. What is Nu Skin Enterprises's P/E ratio? Well, based on the last twelve months it is 18.10. That is equivalent to an earnings yield of about 5.5%.
View our latest analysis for Nu Skin Enterprises
How Do You Calculate A P/E Ratio?
The formula for price to earnings is:
Price to Earnings Ratio = Share Price ÷ Earnings per Share (EPS)
Or for Nu Skin Enterprises:
P/E of 18.10 = USD37.74 ÷ USD2.08 (Based on the year to September 2019.)
Is A High P/E Ratio Good?
The higher the P/E ratio, the higher the price tag of a business, relative to its trailing earnings. That isn't a good or a bad thing on its own, but a high P/E means that buyers have a higher opinion of the business's prospects, relative to stocks with a lower P/E.
How Does Nu Skin Enterprises's P/E Ratio Compare To Its Peers?
We can get an indication of market expectations by looking at the P/E ratio. The image below shows that Nu Skin Enterprises has a P/E ratio that is roughly in line with the personal products industry average (17.4).
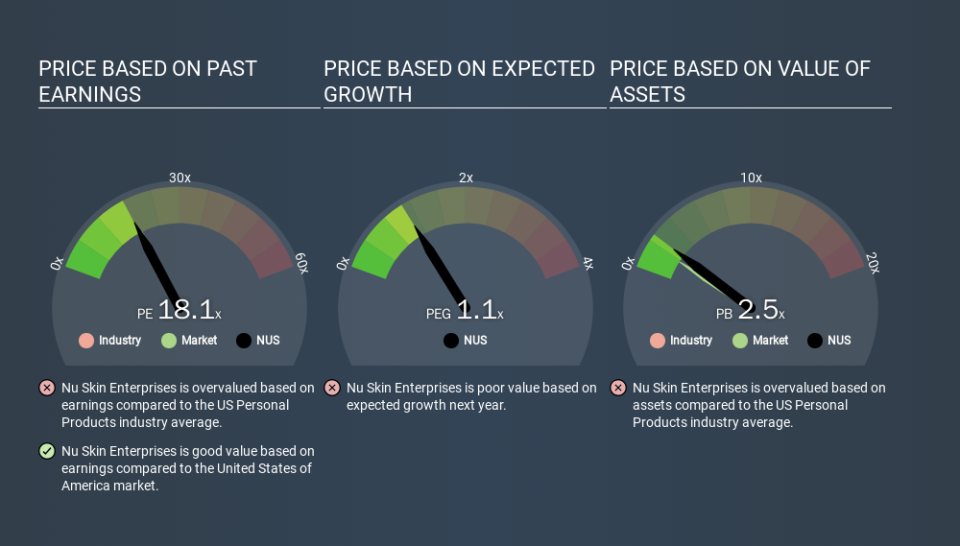
Nu Skin Enterprises's P/E tells us that market participants think its prospects are roughly in line with its industry. So if Nu Skin Enterprises actually outperforms its peers going forward, that should be a positive for the share price. Checking factors such as director buying and selling. could help you form your own view on if that will happen.
How Growth Rates Impact P/E Ratios
If earnings fall then in the future the 'E' will be lower. Therefore, even if you pay a low multiple of earnings now, that multiple will become higher in the future. So while a stock may look cheap based on past earnings, it could be expensive based on future earnings.
Nu Skin Enterprises's earnings per share fell by 28% in the last twelve months. And EPS is down 14% a year, over the last 5 years. This might lead to muted expectations.
Remember: P/E Ratios Don't Consider The Balance Sheet
It's important to note that the P/E ratio considers the market capitalization, not the enterprise value. So it won't reflect the advantage of cash, or disadvantage of debt. Hypothetically, a company could reduce its future P/E ratio by spending its cash (or taking on debt) to achieve higher earnings.
While growth expenditure doesn't always pay off, the point is that it is a good option to have; but one that the P/E ratio ignores.
So What Does Nu Skin Enterprises's Balance Sheet Tell Us?
Nu Skin Enterprises's net debt is 1.9% of its market cap. It would probably trade on a higher P/E ratio if it had a lot of cash, but I doubt it is having a big impact.
The Verdict On Nu Skin Enterprises's P/E Ratio
Nu Skin Enterprises has a P/E of 18.1. That's around the same as the average in the US market, which is 18.8. When you consider the lack of EPS growth last year (along with some debt), it seems the market is optimistic about the future for the business.
When the market is wrong about a stock, it gives savvy investors an opportunity. As value investor Benjamin Graham famously said, 'In the short run, the market is a voting machine but in the long run, it is a weighing machine. So this free visual report on analyst forecasts could hold the key to an excellent investment decision.
You might be able to find a better buy than Nu Skin Enterprises. If you want a selection of possible winners, check out this free list of interesting companies that trade on a P/E below 20 (but have proven they can grow earnings).
If you spot an error that warrants correction, please contact the editor at editorial-team@simplywallst.com. This article by Simply Wall St is general in nature. It does not constitute a recommendation to buy or sell any stock, and does not take account of your objectives, or your financial situation. Simply Wall St has no position in the stocks mentioned.
We aim to bring you long-term focused research analysis driven by fundamental data. Note that our analysis may not factor in the latest price-sensitive company announcements or qualitative material. Thank you for reading.
