
 Yahoo Finance
 Should You Worry About Record plc’s (LON:REC) CEO Pay?

James Wood-Collins became the CEO of Record plc (LON:REC) in 2010. This report will, first, examine the CEO compensation levels in comparison to CEO compensation at companies of similar size. After that, we will consider the growth in the business. Third, we’ll reflect on the total return to shareholders over three years, as a second measure of business performance. This process should give us an idea about how appropriately the CEO is paid.
See our latest analysis for Record
Want to help shape the future of investing tools and platforms? Take the survey and be part of one of the most advanced studies of stock market investors to date.
How Does James Wood-Collins’s Compensation Compare With Similar Sized Companies?
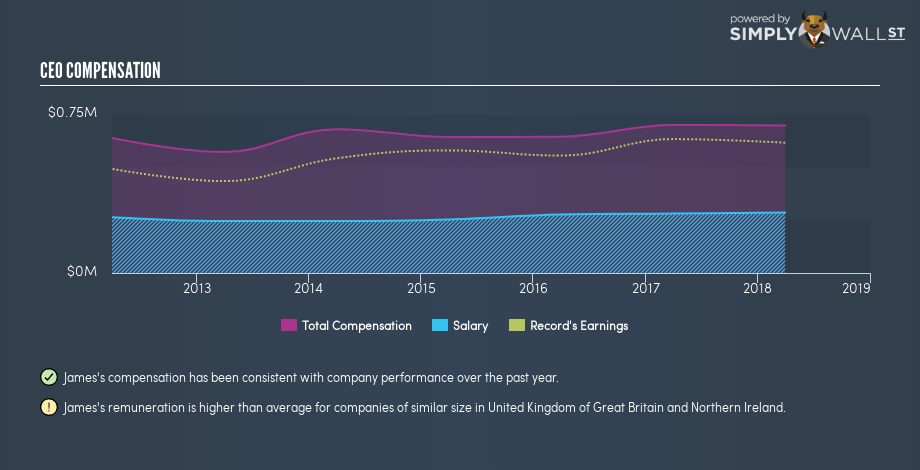
Our data indicates that Record plc is worth UK£59m, and total annual CEO compensation is UK£696k. (This figure is for the year to 2018). While we always look at total compensation first, we note that the salary component is less, at UK£286k. We took a group of companies with market capitalizations below UK£155m, and calculated the median CEO compensation to be UK£245k.
Thus we can conclude that James Wood-Collins receives more in total compensation than the median of a group of companies in the same market, and of similar size to Record plc. However, this doesn’t necessarily mean the pay is too high. We can get a better idea of how generous the pay is by looking at the performance of the underlying business.
You can see, below, how CEO compensation at Record has changed over time.
Is Record plc Growing?
Over the last three years Record plc has grown its earnings per share (EPS) by an average of 7.0% per year (using a line of best fit). The trailing twelve months of revenue was pretty much the same as the prior period.
I would argue that the lack of revenue growth in the last year is less than ideal, but the improvement in EPS is good. These two metric are moving in different directions, so while it’s hard to be confident judging performance, we think the stock is worth watching.
You might want to check this free visual report on analyst forecasts for future earnings.
Has Record plc Been A Good Investment?
Boasting a total shareholder return of 50% over three years, Record plc has done well by shareholders. As a result, some may believe the CEO should be paid more than is normal for companies of similar size.
In Summary…
We compared total CEO remuneration at Record plc with the amount paid at companies with a similar market capitalization. Our data suggests that it pays above the median CEO pay within that group.
One might like to have seen stronger growth, but shareholder returns have been pleasing, over the last three years. Considering this fine result for investors, we daresay the CEO compensation might be apt. So you may want to check if insiders are buying Record shares with their own money (free access).
Or you might prefer examine intently this intuitive graph showing past earnings and revenue.
To help readers see past the short term volatility of the financial market, we aim to bring you a long-term focused research analysis purely driven by fundamental data. Note that our analysis does not factor in the latest price-sensitive company announcements.
The author is an independent contributor and at the time of publication had no position in the stocks mentioned. For errors that warrant correction please contact the editor at editorial-team@simplywallst.com.
