
 Yahoo Finance
 Should We Worry About Tate & Lyle plc's (LON:TATE) P/E Ratio?

This article is for investors who would like to improve their understanding of price to earnings ratios (P/E ratios). We'll show how you can use Tate & Lyle plc's (LON:TATE) P/E ratio to inform your assessment of the investment opportunity. Based on the last twelve months, Tate & Lyle's P/E ratio is 16.97. That means that at current prices, buyers pay £16.97 for every £1 in trailing yearly profits.
Check out our latest analysis for Tate & Lyle
How Do You Calculate A P/E Ratio?
The formula for price to earnings is:
Price to Earnings Ratio = Price per Share ÷ Earnings per Share (EPS)
Or for Tate & Lyle:
P/E of 16.97 = £6.64 ÷ £0.39 (Based on the year to March 2019.)
Is A High Price-to-Earnings Ratio Good?
A higher P/E ratio means that investors are paying a higher price for each £1 of company earnings. That is not a good or a bad thing per se, but a high P/E does imply buyers are optimistic about the future.
Does Tate & Lyle Have A Relatively High Or Low P/E For Its Industry?
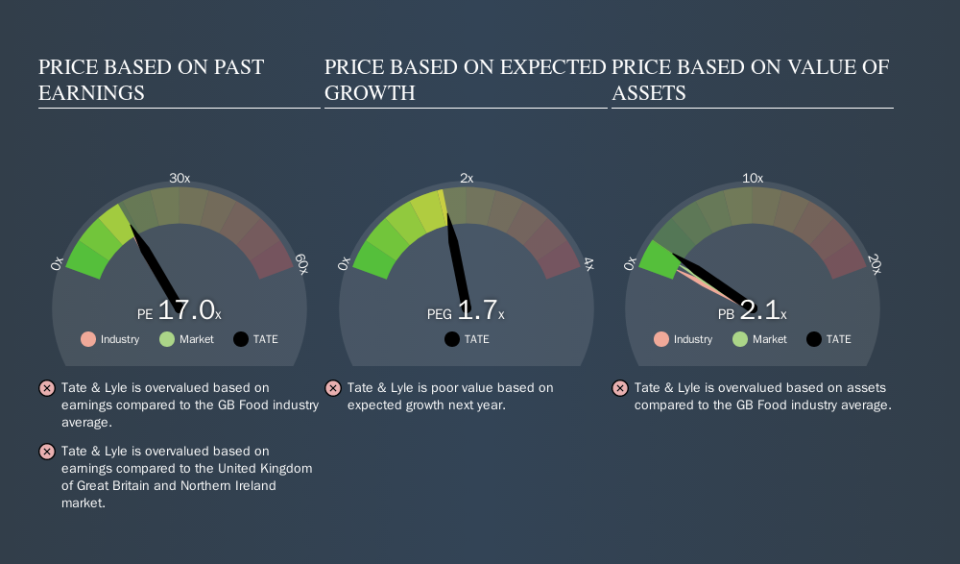
One good way to get a quick read on what market participants expect of a company is to look at its P/E ratio. The image below shows that Tate & Lyle has a P/E ratio that is roughly in line with the food industry average (16.5).
Tate & Lyle's P/E tells us that market participants think its prospects are roughly in line with its industry. If the company has better than average prospects, then the market might be underestimating it. I would further inform my view by checking insider buying and selling., among other things.
How Growth Rates Impact P/E Ratios
Probably the most important factor in determining what P/E a company trades on is the earnings growth. Earnings growth means that in the future the 'E' will be higher. That means unless the share price increases, the P/E will reduce in a few years. A lower P/E should indicate the stock is cheap relative to others -- and that may attract buyers.
Tate & Lyle's earnings per share fell by 31% in the last twelve months. But it has grown its earnings per share by 15% per year over the last three years. And it has shrunk its earnings per share by 5.8% per year over the last five years. This might lead to muted expectations.
Don't Forget: The P/E Does Not Account For Debt or Bank Deposits
One drawback of using a P/E ratio is that it considers market capitalization, but not the balance sheet. In other words, it does not consider any debt or cash that the company may have on the balance sheet. Hypothetically, a company could reduce its future P/E ratio by spending its cash (or taking on debt) to achieve higher earnings.
Such expenditure might be good or bad, in the long term, but the point here is that the balance sheet is not reflected by this ratio.
Tate & Lyle's Balance Sheet
Net debt totals just 9.6% of Tate & Lyle's market cap. The market might award it a higher P/E ratio if it had net cash, but its unlikely this low level of net borrowing is having a big impact on the P/E multiple.
The Verdict On Tate & Lyle's P/E Ratio
Tate & Lyle has a P/E of 17.0. That's around the same as the average in the GB market, which is 17.0. Given it has some debt, but didn't grow last year, the P/E indicates the market is expecting higher profits ahead for the business.
Investors have an opportunity when market expectations about a stock are wrong. If the reality for a company is not as bad as the P/E ratio indicates, then the share price should increase as the market realizes this. So this free report on the analyst consensus forecasts could help you make a master move on this stock.
Of course, you might find a fantastic investment by looking at a few good candidates. So take a peek at this free list of companies with modest (or no) debt, trading on a P/E below 20.
We aim to bring you long-term focused research analysis driven by fundamental data. Note that our analysis may not factor in the latest price-sensitive company announcements or qualitative material.
If you spot an error that warrants correction, please contact the editor at editorial-team@simplywallst.com. This article by Simply Wall St is general in nature. It does not constitute a recommendation to buy or sell any stock, and does not take account of your objectives, or your financial situation. Simply Wall St has no position in the stocks mentioned. Thank you for reading.
