
 Yahoo Finance
 Is It Worth Buying Hunter Douglas N.V. (AMS:HDG) For Its 5.1% Dividend Yield?

Is Hunter Douglas N.V. (AMS:HDG) a good dividend stock? How can we tell? Dividend paying companies with growing earnings can be highly rewarding in the long term. Yet sometimes, investors buy a popular dividend stock because of its yield, and then lose money if the company's dividend doesn't live up to expectations.
A high yield and a long history of paying dividends is an appealing combination for Hunter Douglas. It would not be a surprise to discover that many investors buy it for the dividends. Remember that the recent share price drop will make Hunter Douglas's yield look higher, even though recent events might have impacted the company's prospects. Before you buy any stock for its dividend however, you should always remember Warren Buffett's two rules: 1) Don't lose money, and 2) Remember rule #1. We'll run through some checks below to help with this.
Explore this interactive chart for our latest analysis on Hunter Douglas!
Payout ratios
Companies (usually) pay dividends out of their earnings. If a company is paying more than it earns, the dividend might have to be cut. So we need to form a view on if a company's dividend is sustainable, relative to its net profit after tax. Looking at the data, we can see that 30% of Hunter Douglas's profits were paid out as dividends in the last 12 months. A medium payout ratio strikes a good balance between paying dividends, and keeping enough back to invest in the business. Besides, if reinvestment opportunities dry up, the company has room to increase the dividend.
Another important check we do is to see if the free cash flow generated is sufficient to pay the dividend. Hunter Douglas's cash payout ratio last year was 19%. Cash flows are typically lumpy, but this looks like an appropriately conservative payout. It's encouraging to see that the dividend is covered by both profit and cash flow. This generally suggests the dividend is sustainable, as long as earnings don't drop precipitously.
Remember, you can always get a snapshot of Hunter Douglas's latest financial position, by checking our visualisation of its financial health.
Dividend Volatility
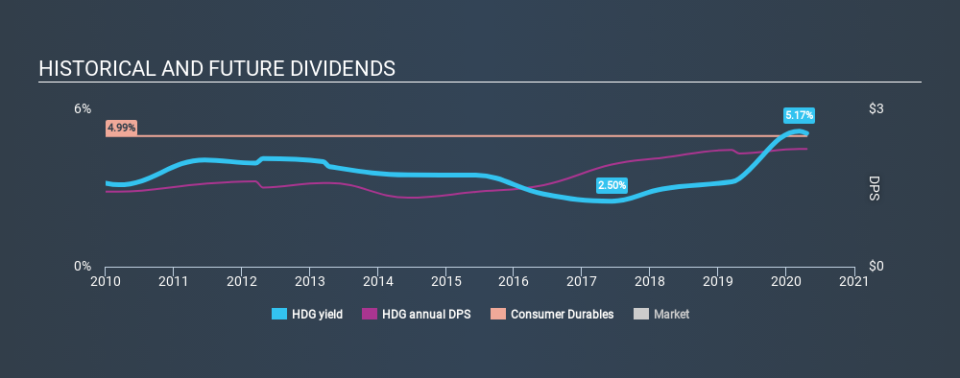
From the perspective of an income investor who wants to earn dividends for many years, there is not much point buying a stock if its dividend is regularly cut or is not reliable. For the purpose of this article, we only scrutinise the last decade of Hunter Douglas's dividend payments. The dividend has been stable over the past 10 years, which is great. We think this could suggest some resilience to the business and its dividends. During the past ten-year period, the first annual payment was US$1.43 in 2010, compared to US$2.25 last year. Dividends per share have grown at approximately 4.6% per year over this time.
Dividends have grown relatively slowly, which is not great, but some investors may value the relative consistency of the dividend.
Dividend Growth Potential
Dividend payments have been consistent over the past few years, but we should always check if earnings per share (EPS) are growing, as this will help maintain the purchasing power of the dividend. Strong earnings per share (EPS) growth might encourage our interest in the company despite fluctuating dividends, which is why it's great to see Hunter Douglas has grown its earnings per share at 17% per annum over the past five years. A company paying out less than a quarter of its earnings as dividends, and growing earnings at more than 10% per annum, looks to be right in the cusp of its growth phase. At the right price, we might be interested.
Conclusion
To summarise, shareholders should always check that Hunter Douglas's dividends are affordable, that its dividend payments are relatively stable, and that it has decent prospects for growing its earnings and dividend. First, we like that the company's dividend payments appear well covered, although the retained capital also needs to be effectively reinvested. That said, we were glad to see it growing earnings and paying a fairly consistent dividend. Hunter Douglas has met all of our criteria, including having strong cash flow that covers the dividend. We definitely think it would be worthwhile looking closer.
Market movements attest to how highly valued a consistent dividend policy is compared to one which is more unpredictable. However, there are other things to consider for investors when analysing stock performance. Taking the debate a bit further, we've identified 1 warning sign for Hunter Douglas that investors need to be conscious of moving forward.
If you are a dividend investor, you might also want to look at our curated list of dividend stocks yielding above 3%.
If you spot an error that warrants correction, please contact the editor at editorial-team@simplywallst.com. This article by Simply Wall St is general in nature. It does not constitute a recommendation to buy or sell any stock, and does not take account of your objectives, or your financial situation. Simply Wall St has no position in the stocks mentioned.
We aim to bring you long-term focused research analysis driven by fundamental data. Note that our analysis may not factor in the latest price-sensitive company announcements or qualitative material. Thank you for reading.
