
 Yahoo Finance
 Do You Like WPP plc (LON:WPP) At This P/E Ratio?

Today, we'll introduce the concept of the P/E ratio for those who are learning about investing. We'll look at WPP plc's (LON:WPP) P/E ratio and reflect on what it tells us about the company's share price. Looking at earnings over the last twelve months, WPP has a P/E ratio of 10.68. That corresponds to an earnings yield of approximately 9.4%.
View our latest analysis for WPP
How Do You Calculate WPP's P/E Ratio?
The formula for price to earnings is:
Price to Earnings Ratio = Share Price ÷ Earnings per Share (EPS)
Or for WPP:
P/E of 10.68 = £9.1 ÷ £0.85 (Based on the trailing twelve months to December 2018.)
Is A High Price-to-Earnings Ratio Good?
The higher the P/E ratio, the higher the price tag of a business, relative to its trailing earnings. That is not a good or a bad thing per se, but a high P/E does imply buyers are optimistic about the future.
How Growth Rates Impact P/E Ratios
When earnings fall, the 'E' decreases, over time. That means even if the current P/E is low, it will increase over time if the share price stays flat. So while a stock may look cheap based on past earnings, it could be expensive based on future earnings.
WPP shrunk earnings per share by 41% over the last year. But it has grown its earnings per share by 3.3% per year over the last five years. And EPS is down 1.8% a year, over the last 3 years. This could justify a low P/E.
How Does WPP's P/E Ratio Compare To Its Peers?
The P/E ratio essentially measures market expectations of a company. We can see in the image below that the average P/E (21.4) for companies in the media industry is higher than WPP's P/E.
WPP's P/E tells us that market participants think it will not fare as well as its peers in the same industry. Many investors like to buy stocks when the market is pessimistic about their prospects. If you consider the stock interesting, further research is recommended. For example, I often monitor director buying and selling.
Remember: P/E Ratios Don't Consider The Balance Sheet
It's important to note that the P/E ratio considers the market capitalization, not the enterprise value. In other words, it does not consider any debt or cash that the company may have on the balance sheet. The exact same company would hypothetically deserve a higher P/E ratio if it had a strong balance sheet, than if it had a weak one with lots of debt, because a cashed up company can spend on growth.
Such spending might be good or bad, overall, but the key point here is that you need to look at debt to understand the P/E ratio in context.
So What Does WPP's Balance Sheet Tell Us?
Net debt is 35% of WPP's market cap. While that's enough to warrant consideration, it doesn't really concern us.
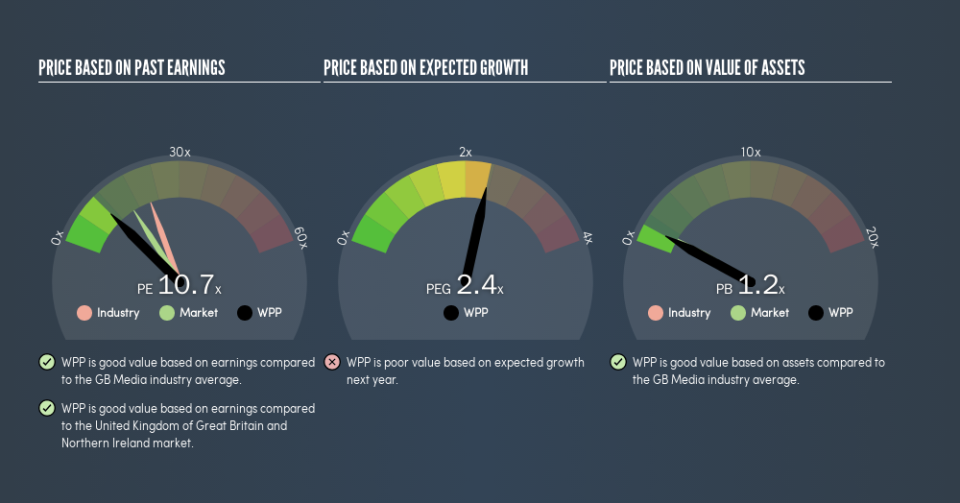
The Verdict On WPP's P/E Ratio
WPP trades on a P/E ratio of 10.7, which is below the GB market average of 16.3. The debt levels are not a major concern, but the lack of EPS growth is likely weighing on sentiment.
Investors should be looking to buy stocks that the market is wrong about. As value investor Benjamin Graham famously said, 'In the short run, the market is a voting machine but in the long run, it is a weighing machine.' So this free visualization of the analyst consensus on future earnings could help you make the right decision about whether to buy, sell, or hold.
Of course you might be able to find a better stock than WPP. So you may wish to see this free collection of other companies that have grown earnings strongly.
We aim to bring you long-term focused research analysis driven by fundamental data. Note that our analysis may not factor in the latest price-sensitive company announcements or qualitative material.
If you spot an error that warrants correction, please contact the editor at editorial-team@simplywallst.com. This article by Simply Wall St is general in nature. It does not constitute a recommendation to buy or sell any stock, and does not take account of your objectives, or your financial situation. Simply Wall St has no position in the stocks mentioned. Thank you for reading.
