
 Yahoo Finance
 Can Xero (ASX:XRO) Continue To Grow Its Returns On Capital?
There are a few key trends to look for if we want to identify the next multi-bagger. In a perfect world, we'd like to see a company investing more capital into its business and ideally the returns earned from that capital are also increasing. Basically this means that a company has profitable initiatives that it can continue to reinvest in, which is a trait of a compounding machine. Speaking of which, we noticed some great changes in Xero's (ASX:XRO) returns on capital, so let's have a look.
Understanding Return On Capital Employed (ROCE)
For those who don't know, ROCE is a measure of a company's yearly pre-tax profit (its return), relative to the capital employed in the business. To calculate this metric for Xero, this is the formula:
Return on Capital Employed = Earnings Before Interest and Tax (EBIT) ÷ (Total Assets - Current Liabilities)
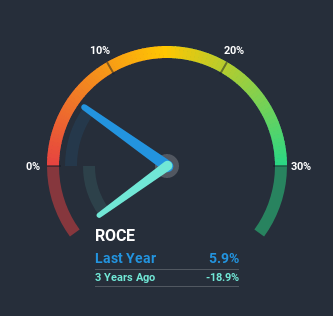
0.059 = NZ$78m ÷ (NZ$1.4b - NZ$107m) (Based on the trailing twelve months to September 2020).
Therefore, Xero has an ROCE of 5.9%. In absolute terms, that's a low return and it also under-performs the Software industry average of 13%.
See our latest analysis for Xero
In the above chart we have measured Xero's prior ROCE against its prior performance, but the future is arguably more important. If you'd like to see what analysts are forecasting going forward, you should check out our free report for Xero.
What Does the ROCE Trend For Xero Tell Us?
The fact that Xero is now generating some pre-tax profits from its prior investments is very encouraging. The company was generating losses five years ago, but now it's earning 5.9% which is a sight for sore eyes. And unsurprisingly, like most companies trying to break into the black, Xero is utilizing 314% more capital than it was five years ago. This can tell us that the company has plenty of reinvestment opportunities that are able to generate higher returns.
In Conclusion...
Long story short, we're delighted to see that Xero's reinvestment activities have paid off and the company is now profitable. Since the stock has returned a staggering 695% to shareholders over the last five years, it looks like investors are recognizing these changes. So given the stock has proven it has promising trends, it's worth researching the company further to see if these trends are likely to persist.
If you want to continue researching Xero, you might be interested to know about the 3 warning signs that our analysis has discovered.
For those who like to invest in solid companies, check out this free list of companies with solid balance sheets and high returns on equity.
This article by Simply Wall St is general in nature. It does not constitute a recommendation to buy or sell any stock, and does not take account of your objectives, or your financial situation. We aim to bring you long-term focused analysis driven by fundamental data. Note that our analysis may not factor in the latest price-sensitive company announcements or qualitative material. Simply Wall St has no position in any stocks mentioned.
Have feedback on this article? Concerned about the content? Get in touch with us directly. Alternatively, email editorial-team@simplywallst.com.
