
 Yahoo Finance
 When Will Xeros Technology Group plc (LON:XSG) Become Profitable?
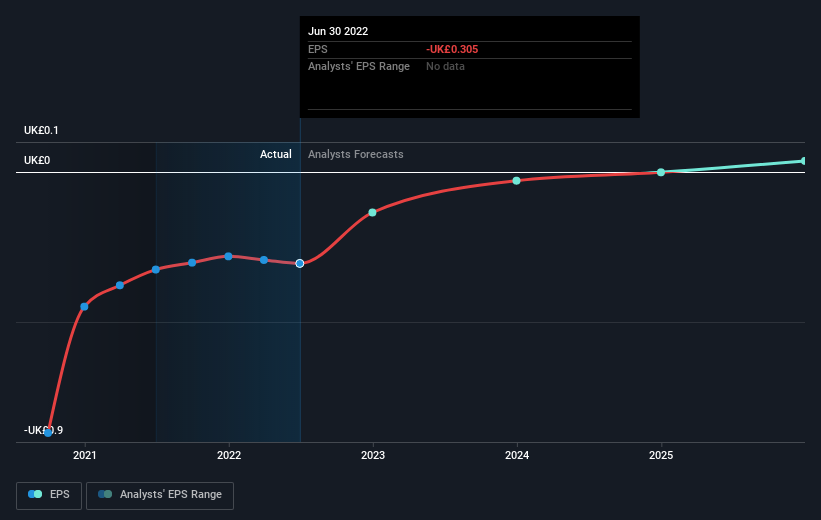
We feel now is a pretty good time to analyse Xeros Technology Group plc's (LON:XSG) business as it appears the company may be on the cusp of a considerable accomplishment. Xeros Technology Group plc, together with its subsidiaries, develops and commercializes polymer-based technologies in Europe, North America, and internationally. The UK£7.4m market-cap company posted a loss in its most recent financial year of UK£6.4m and a latest trailing-twelve-month loss of UK£7.3m leading to an even wider gap between loss and breakeven. As path to profitability is the topic on Xeros Technology Group's investors mind, we've decided to gauge market sentiment. We've put together a brief outline of industry analyst expectations for the company, its year of breakeven and its implied growth rate.
See our latest analysis for Xeros Technology Group
According to some industry analysts covering Xeros Technology Group, breakeven is near. They anticipate the company to incur a final loss in 2024, before generating positive profits of UK£5.6m in 2025. So, the company is predicted to breakeven approximately 2 years from now. In order to meet this breakeven date, we calculated the rate at which the company must grow year-on-year. It turns out an average annual growth rate of 76% is expected, which is rather optimistic! Should the business grow at a slower rate, it will become profitable at a later date than expected.
Given this is a high-level overview, we won’t go into details of Xeros Technology Group's upcoming projects, but, keep in mind that generally a high forecast growth rate is not unusual for a company that is currently undergoing an investment period.
Before we wrap up, there’s one aspect worth mentioning. Xeros Technology Group currently has no debt on its balance sheet, which is rare for a loss-making growth company, which usually has a high level of debt relative to its equity. The company currently operates purely off its shareholder funding and has no debt obligation, reducing concerns around repayments and making it a less risky investment.
Next Steps:
There are too many aspects of Xeros Technology Group to cover in one brief article, but the key fundamentals for the company can all be found in one place – Xeros Technology Group's company page on Simply Wall St. We've also compiled a list of key aspects you should further research:
Valuation: What is Xeros Technology Group worth today? Has the future growth potential already been factored into the price? The intrinsic value infographic in our free research report helps visualize whether Xeros Technology Group is currently mispriced by the market.
Management Team: An experienced management team on the helm increases our confidence in the business – take a look at who sits on Xeros Technology Group’s board and the CEO’s background.
Other High-Performing Stocks: Are there other stocks that provide better prospects with proven track records? Explore our free list of these great stocks here.
Have feedback on this article? Concerned about the content? Get in touch with us directly. Alternatively, email editorial-team (at) simplywallst.com.
This article by Simply Wall St is general in nature. We provide commentary based on historical data and analyst forecasts only using an unbiased methodology and our articles are not intended to be financial advice. It does not constitute a recommendation to buy or sell any stock, and does not take account of your objectives, or your financial situation. We aim to bring you long-term focused analysis driven by fundamental data. Note that our analysis may not factor in the latest price-sensitive company announcements or qualitative material. Simply Wall St has no position in any stocks mentioned.
Join A Paid User Research Session
You’ll receive a US$30 Amazon Gift card for 1 hour of your time while helping us build better investing tools for the individual investors like yourself. Sign up here
