
 Yahoo Finance
 XP Factory (LON:XPF) shareholders have earned a 106% return over the last year
XP Factory Plc (LON:XPF) shareholders might be concerned after seeing the share price drop 16% in the last month. On the other hand, over the last twelve months the stock has delivered rather impressive returns. Like an eagle, the share price soared 103% in that time. So we think most shareholders won't be too upset about the recent fall. More important, going forward, is how the business itself is going.
So let's assess the underlying fundamentals over the last 1 year and see if they've moved in lock-step with shareholder returns.
See our latest analysis for XP Factory
Because XP Factory made a loss in the last twelve months, we think the market is probably more focussed on revenue and revenue growth, at least for now. When a company doesn't make profits, we'd generally expect to see good revenue growth. That's because fast revenue growth can be easily extrapolated to forecast profits, often of considerable size.
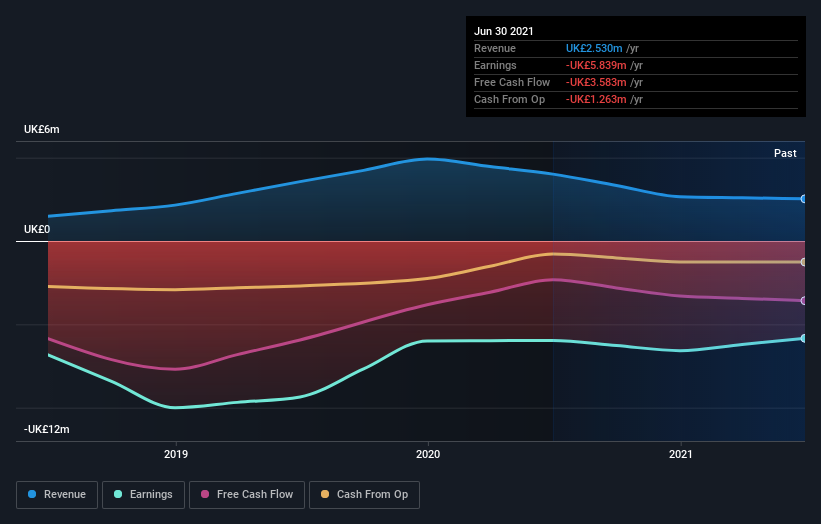
XP Factory actually shrunk its revenue over the last year, with a reduction of 37%. We're a little surprised to see the share price pop 103% in the last year. It just goes to show the market doesn't always pay attention to the reported numbers. Of course, it could be that the market expected this revenue drop.
The image below shows how earnings and revenue have tracked over time (if you click on the image you can see greater detail).
This free interactive report on XP Factory's balance sheet strength is a great place to start, if you want to investigate the stock further.
What about the Total Shareholder Return (TSR)?
We'd be remiss not to mention the difference between XP Factory's total shareholder return (TSR) and its share price return. The TSR attempts to capture the value of dividends (as if they were reinvested) as well as any spin-offs or discounted capital raisings offered to shareholders. We note that XP Factory's TSR, at 106% is higher than its share price return of 103%. When you consider it hasn't been paying a dividend, this data suggests shareholders have benefitted from a spin-off, or had the opportunity to acquire attractively priced shares in a discounted capital raising.
A Different Perspective
It's good to see that XP Factory has rewarded shareholders with a total shareholder return of 106% in the last twelve months. Notably the five-year annualised TSR loss of 13% per year compares very unfavourably with the recent share price performance. We generally put more weight on the long term performance over the short term, but the recent improvement could hint at a (positive) inflection point within the business. It's always interesting to track share price performance over the longer term. But to understand XP Factory better, we need to consider many other factors. Like risks, for instance. Every company has them, and we've spotted 5 warning signs for XP Factory (of which 3 don't sit too well with us!) you should know about.
Of course XP Factory may not be the best stock to buy. So you may wish to see this free collection of growth stocks.
Please note, the market returns quoted in this article reflect the market weighted average returns of stocks that currently trade on GB exchanges.
Have feedback on this article? Concerned about the content? Get in touch with us directly. Alternatively, email editorial-team (at) simplywallst.com.
This article by Simply Wall St is general in nature. We provide commentary based on historical data and analyst forecasts only using an unbiased methodology and our articles are not intended to be financial advice. It does not constitute a recommendation to buy or sell any stock, and does not take account of your objectives, or your financial situation. We aim to bring you long-term focused analysis driven by fundamental data. Note that our analysis may not factor in the latest price-sensitive company announcements or qualitative material. Simply Wall St has no position in any stocks mentioned.
