
 Yahoo Finance
 Xpediator Plc (LON:XPD) Stock Is Going Strong But Fundamentals Look Uncertain: What Lies Ahead ?

Xpediator (LON:XPD) has had a great run on the share market with its stock up by a significant 24% over the last month. However, we decided to pay attention to the company's fundamentals which don't appear to give a clear sign about the company's financial health. Particularly, we will be paying attention to Xpediator's ROE today.
ROE or return on equity is a useful tool to assess how effectively a company can generate returns on the investment it received from its shareholders. Put another way, it reveals the company's success at turning shareholder investments into profits.
Check out our latest analysis for Xpediator
How To Calculate Return On Equity?
ROE can be calculated by using the formula:
Return on Equity = Net Profit (from continuing operations) ÷ Shareholders' Equity
So, based on the above formula, the ROE for Xpediator is:
4.7% = UK£1.4m ÷ UK£29m (Based on the trailing twelve months to June 2020).
The 'return' is the yearly profit. Another way to think of that is that for every £1 worth of equity, the company was able to earn £0.05 in profit.
What Is The Relationship Between ROE And Earnings Growth?
So far, we've learned that ROE is a measure of a company's profitability. We now need to evaluate how much profit the company reinvests or "retains" for future growth which then gives us an idea about the growth potential of the company. Assuming all else is equal, companies that have both a higher return on equity and higher profit retention are usually the ones that have a higher growth rate when compared to companies that don't have the same features.
Xpediator's Earnings Growth And 4.7% ROE
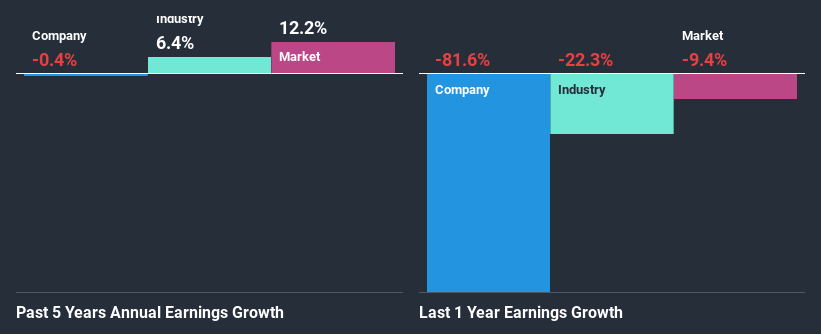
When you first look at it, Xpediator's ROE doesn't look that attractive. A quick further study shows that the company's ROE doesn't compare favorably to the industry average of 8.0% either. As a result, Xpediator's flat net income growth over the past five years doesn't come as a surprise given its lower ROE.
We then compared Xpediator's net income growth with the industry and found that the average industry growth rate was 8.9% in the same period.
Earnings growth is an important metric to consider when valuing a stock. The investor should try to establish if the expected growth or decline in earnings, whichever the case may be, is priced in. Doing so will help them establish if the stock's future looks promising or ominous. One good indicator of expected earnings growth is the P/E ratio which determines the price the market is willing to pay for a stock based on its earnings prospects. So, you may want to check if Xpediator is trading on a high P/E or a low P/E, relative to its industry.
Is Xpediator Making Efficient Use Of Its Profits?
In spite of a normal three-year median payout ratio of 47% (or a retention ratio of 53%), Xpediator hasn't seen much growth in its earnings. Therefore, there might be some other reasons to explain the lack in that respect. For example, the business could be in decline.
Additionally, Xpediator has paid dividends over a period of three years, which means that the company's management is determined to pay dividends even if it means little to no earnings growth.
Summary
In total, we're a bit ambivalent about Xpediator's performance. While the company does have a high rate of profit retention, its low rate of return is probably hampering its earnings growth. Until now, we have only just grazed the surface of the company's past performance by looking at the company's fundamentals. To gain further insights into Xpediator's past profit growth, check out this visualization of past earnings, revenue and cash flows.
This article by Simply Wall St is general in nature. It does not constitute a recommendation to buy or sell any stock, and does not take account of your objectives, or your financial situation. We aim to bring you long-term focused analysis driven by fundamental data. Note that our analysis may not factor in the latest price-sensitive company announcements or qualitative material. Simply Wall St has no position in any stocks mentioned.
Have feedback on this article? Concerned about the content? Get in touch with us directly. Alternatively, email editorial-team@simplywallst.com.
