
 Yahoo Finance
 Yamana Gold Inc. (TSE:YRI) Is An Attractive Dividend Stock - Here's Why
Dividend paying stocks like Yamana Gold Inc. (TSE:YRI) tend to be popular with investors, and for good reason - some research suggests a significant amount of all stock market returns come from reinvested dividends. Unfortunately, it's common for investors to be enticed in by the seemingly attractive yield, and lose money when the company has to cut its dividend payments.
A 1.0% yield is nothing to get excited about, but investors probably think the long payment history suggests Yamana Gold has some staying power. Before you buy any stock for its dividend however, you should always remember Warren Buffett's two rules: 1) Don't lose money, and 2) Remember rule #1. We'll run through some checks below to help with this.
Click the interactive chart for our full dividend analysis
Payout ratios
Dividends are typically paid from company earnings. If a company pays more in dividends than it earned, then the dividend might become unsustainable - hardly an ideal situation. Comparing dividend payments to a company's net profit after tax is a simple way of reality-checking whether a dividend is sustainable. Yamana Gold paid out 16% of its profit as dividends, over the trailing twelve month period. Given the low payout ratio, it is hard to envision the dividend coming under threat, barring a catastrophe.
Another important check we do is to see if the free cash flow generated is sufficient to pay the dividend. Yamana Gold's cash payout ratio last year was 24%. Cash flows are typically lumpy, but this looks like an appropriately conservative payout. It's positive to see that Yamana Gold's dividend is covered by both profits and cash flow, since this is generally a sign that the dividend is sustainable, and a lower payout ratio usually suggests a greater margin of safety before the dividend gets cut.
Is Yamana Gold's Balance Sheet Risky?
As Yamana Gold has a meaningful amount of debt, we need to check its balance sheet to see if the company might have debt risks. A quick check of its financial situation can be done with two ratios: net debt divided by EBITDA (earnings before interest, tax, depreciation and amortisation), and net interest cover. Net debt to EBITDA is a measure of a company's total debt. Net interest cover measures the ability to meet interest payments. Essentially we check that a) the company does not have too much debt, and b) that it can afford to pay the interest. Yamana Gold has net debt of 1.48 times its EBITDA, which is generally an okay level of debt for most companies.
Net interest cover can be calculated by dividing earnings before interest and tax (EBIT) by the company's net interest expense. With EBIT of 2.29 times its interest expense, Yamana Gold's interest cover is starting to look a bit thin.
We update our data on Yamana Gold every 24 hours, so you can always get our latest analysis of its financial health, here.
Dividend Volatility
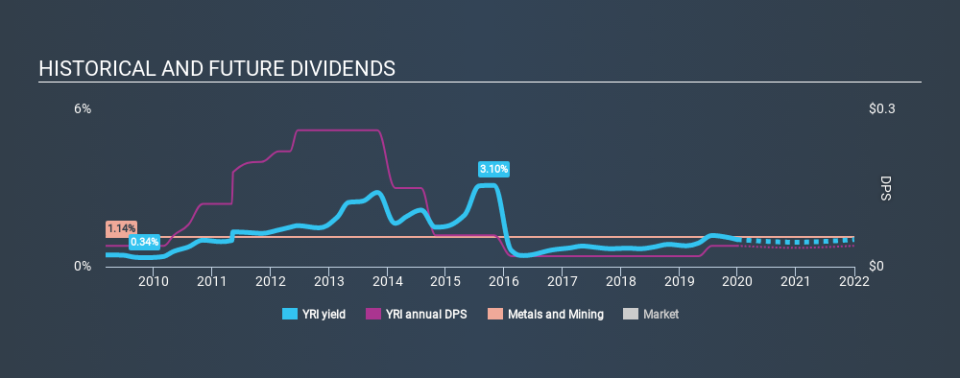
One of the major risks of relying on dividend income, is the potential for a company to struggle financially and cut its dividend. Not only is your income cut, but the value of your investment declines as well - nasty. Yamana Gold has been paying dividends for a long time, but for the purpose of this analysis, we only examine the past 10 years of payments. Its dividend payments have fallen by 20% or more on at least one occasion over the past ten years. Its most recent annual dividend was US$0.04 per share, effectively flat on its first payment ten years ago.
Modest growth in the dividend is good to see, but we think this is offset by historical cuts to the payments. It is hard to live on a dividend income if the company's earnings are not consistent.
Dividend Growth Potential
With a relatively unstable dividend, it's even more important to see if earnings per share (EPS) are growing. Why take the risk of a dividend getting cut, unless there's a good chance of bigger dividends in future? It's good to see Yamana Gold has been growing its earnings per share at 45% a year over the past five years. The company is only paying out a fraction of its earnings as dividends, and in the past been able to use the retained earnings to grow its profits rapidly - an ideal combination.
Conclusion
To summarise, shareholders should always check that Yamana Gold's dividends are affordable, that its dividend payments are relatively stable, and that it has decent prospects for growing its earnings and dividend. First, we like that the company's dividend payments appear well covered, although the retained capital also needs to be effectively reinvested. Next, earnings growth has been good, but unfortunately the dividend has been cut at least once in the past. Overall we think Yamana Gold scores well on our analysis. It's not quite perfect, but we'd definitely be keen to take a closer look.
Companies that are growing earnings tend to be the best dividend stocks over the long term. See what the 12 analysts we track are forecasting for Yamana Gold for free with public analyst estimates for the company.
If you are a dividend investor, you might also want to look at our curated list of dividend stocks yielding above 3%.
If you spot an error that warrants correction, please contact the editor at editorial-team@simplywallst.com. This article by Simply Wall St is general in nature. It does not constitute a recommendation to buy or sell any stock, and does not take account of your objectives, or your financial situation. Simply Wall St has no position in the stocks mentioned.
We aim to bring you long-term focused research analysis driven by fundamental data. Note that our analysis may not factor in the latest price-sensitive company announcements or qualitative material. Thank you for reading.
