
 Yahoo Finance
 Yamana Gold Inc. (TSE:YRI): Time For A Financial Health Check
Want to participate in a short research study? Help shape the future of investing tools and you could win a $250 gift card!
While small-cap stocks, such as Yamana Gold Inc. (TSE:YRI) with its market cap of CA$2.4b, are popular for their explosive growth, investors should also be aware of their balance sheet to judge whether the company can survive a downturn. Since YRI is loss-making right now, it’s crucial to understand the current state of its operations and pathway to profitability. We'll look at some basic checks that can form a snapshot the company’s financial strength. However, this is not a comprehensive overview, so I recommend you dig deeper yourself into YRI here.
Does YRI Produce Much Cash Relative To Its Debt?
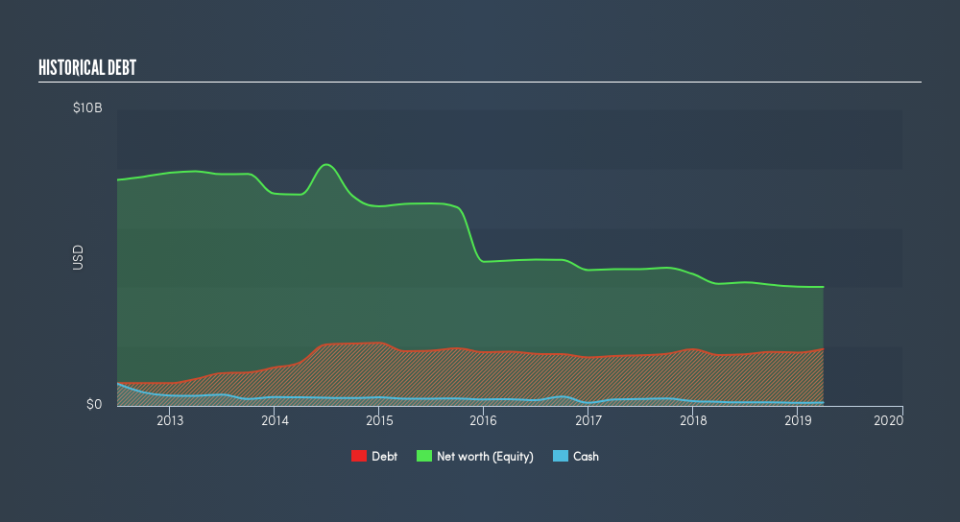
Over the past year, YRI has ramped up its debt from US$1.7b to US$1.9b , which includes long-term debt. With this increase in debt, the current cash and short-term investment levels stands at US$115m , ready to be used for running the business. Additionally, YRI has produced US$294m in operating cash flow in the last twelve months, resulting in an operating cash to total debt ratio of 15%, meaning that YRI’s debt is not covered by operating cash.
Can YRI pay its short-term liabilities?
At the current liabilities level of US$499m, it seems that the business may not have an easy time meeting these commitments with a current assets level of US$462m, leading to a current ratio of 0.93x. The current ratio is the number you get when you divide current assets by current liabilities.
Can YRI service its debt comfortably?
YRI is a relatively highly levered company with a debt-to-equity of 48%. This is a bit unusual for a small-cap stock, since they generally have a harder time borrowing than large more established companies. But since YRI is currently unprofitable, sustainability of its current state of operations becomes a concern. Running high debt, while not yet making money, can be risky in unexpected downturns as liquidity may dry up, making it hard to operate.
Next Steps:
YRI’s high cash coverage means that, although its debt levels are high, the company is able to utilise its borrowings efficiently in order to generate cash flow. But, its lack of liquidity raises questions over current asset management practices for the small-cap. I admit this is a fairly basic analysis for YRI's financial health. Other important fundamentals need to be considered alongside. You should continue to research Yamana Gold to get a more holistic view of the stock by looking at:
Future Outlook: What are well-informed industry analysts predicting for YRI’s future growth? Take a look at our free research report of analyst consensus for YRI’s outlook.
Valuation: What is YRI worth today? Is the stock undervalued, even when its growth outlook is factored into its intrinsic value? The intrinsic value infographic in our free research report helps visualize whether YRI is currently mispriced by the market.
Other High-Performing Stocks: Are there other stocks that provide better prospects with proven track records? Explore our free list of these great stocks here.
We aim to bring you long-term focused research analysis driven by fundamental data. Note that our analysis may not factor in the latest price-sensitive company announcements or qualitative material.
If you spot an error that warrants correction, please contact the editor at editorial-team@simplywallst.com. This article by Simply Wall St is general in nature. It does not constitute a recommendation to buy or sell any stock, and does not take account of your objectives, or your financial situation. Simply Wall St has no position in the stocks mentioned. Thank you for reading.
