
 Yahoo Finance
 Yanlord Land Group (SGX:Z25) shareholders have endured a 43% loss from investing in the stock five years ago
The main aim of stock picking is to find the market-beating stocks. But even the best stock picker will only win with some selections. So we wouldn't blame long term Yanlord Land Group Limited (SGX:Z25) shareholders for doubting their decision to hold, with the stock down 54% over a half decade. And some of the more recent buyers are probably worried, too, with the stock falling 32% in the last year. Furthermore, it's down 24% in about a quarter. That's not much fun for holders.
Since shareholders are down over the longer term, lets look at the underlying fundamentals over the that time and see if they've been consistent with returns.
View our latest analysis for Yanlord Land Group
While the efficient markets hypothesis continues to be taught by some, it has been proven that markets are over-reactive dynamic systems, and investors are not always rational. One way to examine how market sentiment has changed over time is to look at the interaction between a company's share price and its earnings per share (EPS).
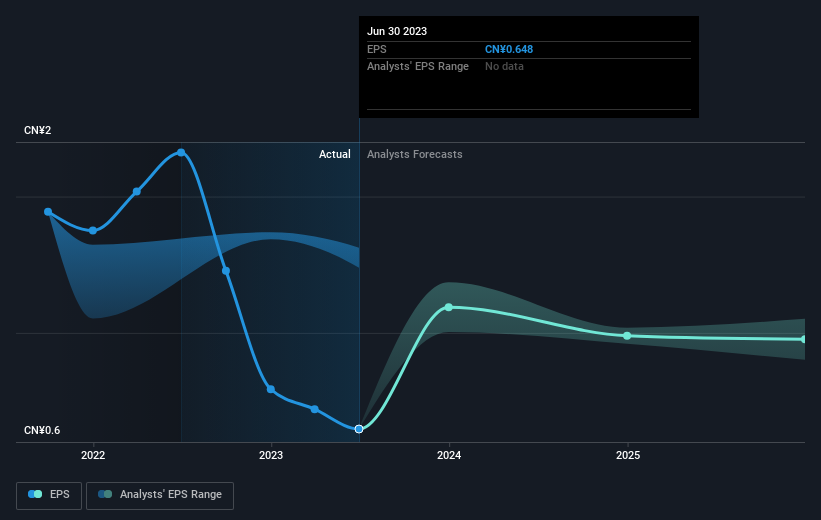
Looking back five years, both Yanlord Land Group's share price and EPS declined; the latter at a rate of 21% per year. The share price decline of 14% per year isn't as bad as the EPS decline. The relatively muted share price reaction might be because the market expects the business to turn around.
The company's earnings per share (over time) is depicted in the image below (click to see the exact numbers).
Dive deeper into Yanlord Land Group's key metrics by checking this interactive graph of Yanlord Land Group's earnings, revenue and cash flow.
A Dividend Lost
The value of past dividends are accounted for in the total shareholder return (TSR), but not in the share price return mentioned above. By accounting for the value of dividends paid, the TSR can be seen as a more complete measure of the value a company brings to its shareholders. Over the last 5 years, Yanlord Land Group generated a TSR of -43%, which is, of course, better than the share price return. Although the company had to cut dividends, it has paid cash to shareholders in the past.
A Different Perspective
Yanlord Land Group shareholders are down 32% for the year, but the market itself is up 3.8%. Even the share prices of good stocks drop sometimes, but we want to see improvements in the fundamental metrics of a business, before getting too interested. Unfortunately, last year's performance may indicate unresolved challenges, given that it was worse than the annualised loss of 7% over the last half decade. Generally speaking long term share price weakness can be a bad sign, though contrarian investors might want to research the stock in hope of a turnaround. It's always interesting to track share price performance over the longer term. But to understand Yanlord Land Group better, we need to consider many other factors. Even so, be aware that Yanlord Land Group is showing 2 warning signs in our investment analysis , you should know about...
But note: Yanlord Land Group may not be the best stock to buy. So take a peek at this free list of interesting companies with past earnings growth (and further growth forecast).
Please note, the market returns quoted in this article reflect the market weighted average returns of stocks that currently trade on Singaporean exchanges.
Have feedback on this article? Concerned about the content? Get in touch with us directly. Alternatively, email editorial-team (at) simplywallst.com.
This article by Simply Wall St is general in nature. We provide commentary based on historical data and analyst forecasts only using an unbiased methodology and our articles are not intended to be financial advice. It does not constitute a recommendation to buy or sell any stock, and does not take account of your objectives, or your financial situation. We aim to bring you long-term focused analysis driven by fundamental data. Note that our analysis may not factor in the latest price-sensitive company announcements or qualitative material. Simply Wall St has no position in any stocks mentioned.
