
 Yahoo Finance
 New York Times Co's Dividend Analysis
Assessing the Upcoming Dividend Payout and Historical Performance
New York Times Co (NYSE:NYT) recently announced a dividend of $0.13 per share, payable on 2024-04-18, with the ex-dividend date set for 2024-04-01. As investors look forward to this upcoming payment, the spotlight also shines on the company's dividend history, yield, and growth rates. Using the data from GuruFocus, let's look into New York Times Co's dividend performance and assess its sustainability.
What Does New York Times Co Do?
This Powerful Chart Made Peter Lynch 29% A Year For 13 Years
How to calculate the intrinsic value of a stock?
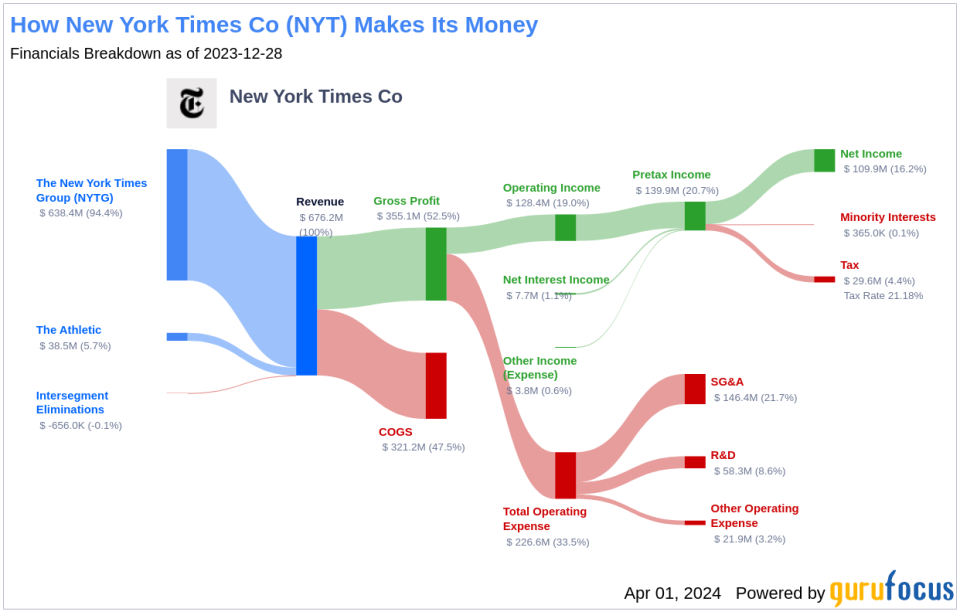
New York Times Co is an American media company known for publishing its flagship newspaper, The New York Times. The company also operates the International New York Times newspaper, as well as digital properties such as NYTimes.com and various smartphone applications. The company has two segments: New York Times Group and The Athletic. The company generates the majority of its revenue from the NYTG segment. The NYTG and The Athletic segments derive revenue from subscriptions, advertising, and others, where the major source of revenue for both segments is subscription.
A Glimpse at New York Times Co's Dividend History
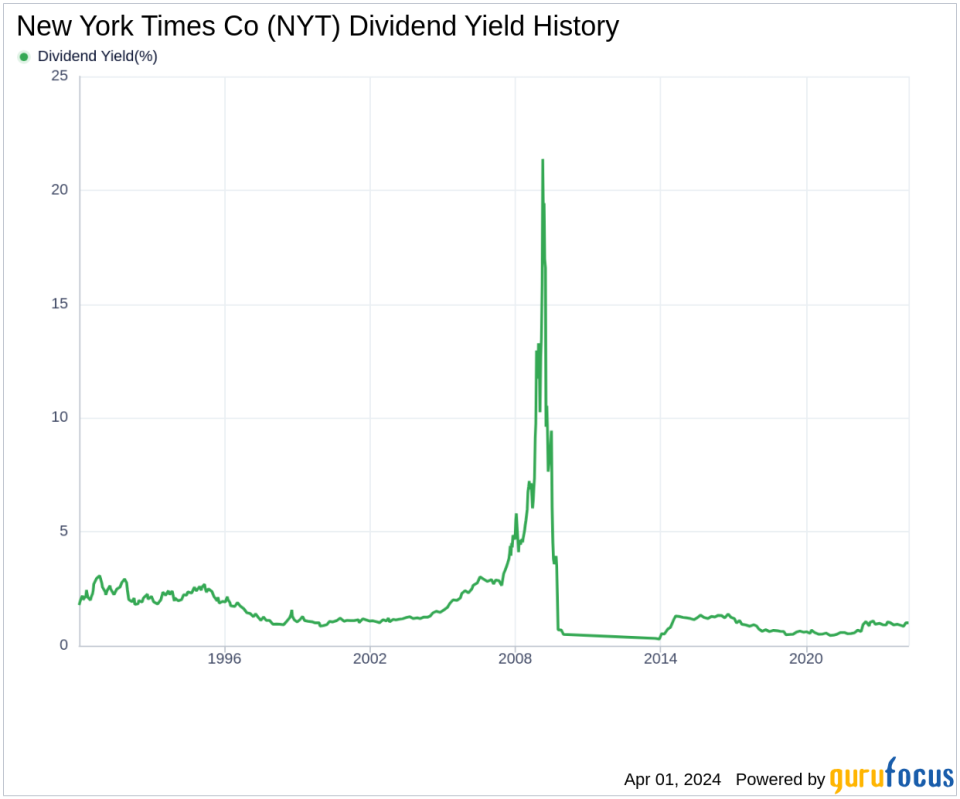
New York Times Co has maintained a consistent dividend payment record since 2013, with dividends currently distributed on a quarterly basis. As a testament to its commitment to returning value to shareholders, New York Times Co has increased its dividend each year since 2013. The stock is thus listed as a dividend achiever, an honor that is given to companies that have increased their dividend each year for at least the past 11 years. Below is a chart showing annual Dividends Per Share for tracking historical trends.
Breaking Down New York Times Co's Dividend Yield and Growth
As of today, New York Times Co currently has a 12-month trailing dividend yield of 1.02% and a 12-month forward dividend yield of 1.20%, suggesting an expectation of increased dividend payments over the next 12 months. Over the past three years, New York Times Co's annual dividend growth rate was 22.40%. Extended to a five-year horizon, this rate decreased to 20.20% per year. And over the past decade, New York Times Co's annual dividends per share growth rate stands at an impressive 17.90%.
Based on New York Times Co's dividend yield and five-year growth rate, the 5-year yield on cost of New York Times Co stock as of today is approximately 2.56%.
The Sustainability Question: Payout Ratio and Profitability
To assess the sustainability of the dividend, one needs to evaluate the company's payout ratio. The dividend payout ratio provides insights into the portion of earnings the company distributes as dividends. A lower ratio suggests that the company retains a significant part of its earnings, thereby ensuring the availability of funds for future growth and unexpected downturns. As of 2023-12-31, New York Times Co's dividend payout ratio is 0.27.
New York Times Co's profitability rank, offers an understanding of the company's earnings prowess relative to its peers. GuruFocus ranks New York Times Co's profitability 8 out of 10 as of 2023-12-31, suggesting good profitability prospects. The company has reported positive net income for each of year over the past decade, further solidifying its high profitability.
Growth Metrics: The Future Outlook
To ensure the sustainability of dividends, a company must have robust growth metrics. New York Times Co's growth rank of 8 out of 10 suggests that the company's growth trajectory is good relative to its competitors. Revenue is the lifeblood of any company, and New York Times Co's revenue per share, combined with the 3-year revenue growth rate, indicates a strong revenue model. New York Times Co's revenue has increased by approximately 11.30% per year on average, a rate that outperforms approximately 74.22% of global competitors.
The company's 3-year EPS growth rate showcases its capability to grow its earnings, a critical component for sustaining dividends in the long run. During the past three years, New York Times Co's earnings increased by approximately 18.90% per year on average, a rate that outperforms approximately 63.53% of global competitors.
Lastly, the company's 5-year EBITDA growth rate of 14.90%, which outperforms approximately 69.82% of global competitors.
Investor Takeaways
New York Times Co's disciplined approach to dividend growth, supported by a responsible payout ratio and robust profitability, underscores its commitment to shareholder returns. The company's impressive growth metrics not only reinforce the sustainability of its dividend but also suggest potential for future capital appreciation. With a forward-looking approach, New York Times Co appears well-positioned to continue its trajectory as a reliable dividend-paying stock. Investors seeking to diversify their portfolios with media sector exposure and stable dividends might find New York Times Co an attractive proposition. As the financial landscape evolves, will New York Times Co maintain its dividend achiever status and continue to reward its shareholders? This is a question value investors should consider as they assess the company's long-term prospects.
GuruFocus Premium users can screen for high-dividend yield stocks using the High Dividend Yield Screener.
This article, generated by GuruFocus, is designed to provide general insights and is not tailored financial advice. Our commentary is rooted in historical data and analyst projections, utilizing an impartial methodology, and is not intended to serve as specific investment guidance. It does not formulate a recommendation to purchase or divest any stock and does not consider individual investment objectives or financial circumstances. Our objective is to deliver long-term, fundamental data-driven analysis. Be aware that our analysis might not incorporate the most recent, price-sensitive company announcements or qualitative information. GuruFocus holds no position in the stocks mentioned herein.
This article first appeared on GuruFocus.
