Take the Zacks Approach to Beat the Markets: Phibro Animal Health, Travelzoo, Ollie's Bargain Outlet in Focus
Last week, all three major U.S. indexes, the Nasdaq Composite, the S&P 500 and the Dow Jones Industrial Average gained 2%, 1.2% and 1.1%, respectively.
The Federal Reserve boosted investor sentiment with a much anticipated 50-basis-point cut in the benchmark lending rate at the FOMC meeting held on Sept. 18. Currently, the overnight interest rate is in the range of 4.75-5.00% after the first cut of the Fed’s fund rate since March 2020.
Laying the Fed’s plan for the coming years, Chairman Jerome Powell, in his speech said the interest rate would fall further by 50 basis points by the end of this year, a full percentage point in 2025, and half of a percentage point in 2026 to bring back interest rates to the 2.75-3% range.
Although the September rate cut was in line with street expectations, the magnitude of it raised concerns about whether the big rate cut was predominantly to avoid an imminent recession.
Regardless of market conditions, we, here at Zacks, provide investors with unbiased guidance on how to beat the market.
As usual, Zacks Research guided investors over the past three months with its time-tested methodologies. Given the prevailing market uncertainty, you may want to look at our feats to prepare better for your next action.
Here are some of our key achievements:
Phibro Animal Health and PulteGroup Following Zacks Rank Upgrade
Shares of Phibro Animal Health Corporation PAHC have gained 18.5% (versus the S&P 500’s 2.9% increase) since it was upgraded to a Zacks Rank #2 (Buy) on July 24.
Another stock, PulteGroup, Inc. PHM, which was upgraded to a Zacks Rank #2 on July 23, has returned 13.1% (versus the S&P 500’s 2.7% increase) since then.
Zacks Rank, our short-term rating system, has earnings estimate revisions at its core. Empirical research shows a strong correlation between trends in earnings estimate revisions and near-term stock price movements.
A hypothetical portfolio of Zacks Rank #1 stocks has returned +6.1% in the year-to-date period through April 1, 2024, vs. +11.3% for the S&P 500 index and +7.7% for the equal-weight version of the S&P 500 index.
This hypothetical portfolio returned +20.63% in 2023 vs. +24.83% for the S&P 500 index and +15% for the equal-weight S&P 500 index.
The portfolio of Zacks Rank #1 stocks is an equal-weight portfolio, while the S&P 500 index is a market-cap-weighted index that has been notably distorted by the concentrated performance of mega-cap stocks since October 2022.
The Zacks Model Portfolio — consisting of Zacks Rank #1 stocks — has outperformed the S&P index by more than 16 percentage points since 1988 (through April 1, 2024, the Zacks # 1 Rank stocks generated an annualized return of +27.6% since 1988 vs. +11.1% for the S&P 500 index).You can see the complete list of today’s Zacks Rank #1 stocks here >>>
Check Phibro Animal Health’s historical EPS and Sales here>>>
Check PulteGroup’s historical EPS and Sales here>>>
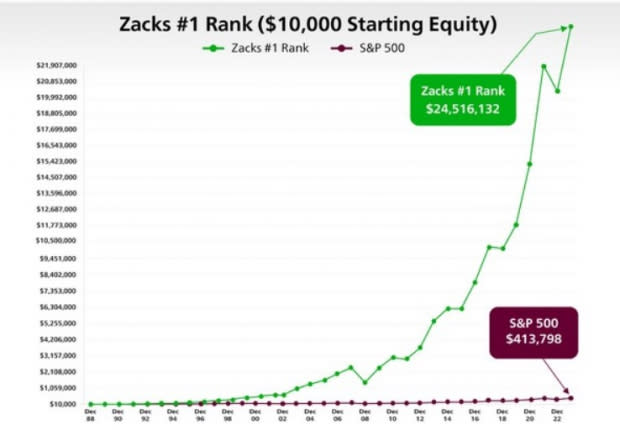
Image Source: Zacks Investment Research
Zacks Recommendation Upgrades Travelzoo and SB Financial
Shares of Travelzoo TZOO and SB Financial Group, Inc. SBFG have advanced 40.7% (versus the S&P 500’s 4.7% increase) and 26.1% (versus the S&P 500’s 4.6% rise), since their Zacks Recommendation was upgraded to Outperform on July 29 and July 30, respectively.
While the Zacks Rank is our short-term rating system that is most effective over the one- to three-month holding horizon, the Zacks Recommendation aims to predict performance over the next 6 to 12 months. However, just like the Zacks Rank, the foundation for the Zacks Recommendation is trends in earnings estimate revisions.
The Zacks Recommendation classifies stocks into three groups — Outperform, Neutral and Underperform. While these recommendations are determined quantitatively, our analysts have the flexibility to override them for the 1100+ stocks they closely follow based on their better judgment of factors such as valuation, industry conditions and management effectiveness than the quantitative model.
To access our research reports with Zacks Recommendations for the 1100+ stocks we cover, click here>>>
Zacks Focus List Stocks Axon Enterprise, Solventum Shoot Up
Shares of Axon Enterprise, Inc. AXON, which belongs to the Zacks Focus List, have gained 33.7% over the past 12 weeks. The stock was added to the Focus List on June 3, 2020. Another Focus-List holding, Solventum Corporation SOLV, which was added to the portfolio on April 1, 2024, has returned 32.3% over the past 12 weeks. The S&P 500 has advanced 5% over this period.
The Focus List portfolio returned +10.23% in 2024 Q1 vs. +10.56% for the S&P 500 index and +7.9% for the equal-weight S&P 500 index.
The 50-stock Zacks Focus List model portfolio returned +31.44% in 2023 vs. +26.28% for the S&P 500 index and +13.61% for the equal-weight S&P 500 index. In 2022, the portfolio produced -15.2% vs. the S&P 500 index’s -17.96%.
Since 2004, the Focus List portfolio has produced an annualized return of +11.91% (through March 31, 2024). This compares to a +10.25% annualized return for the S&P 500 index in the same time period.
Unlock all of our powerful research, tools and analysis, including the Focus List, Zacks #1 Rank List, Equity Research Reports, Zacks Earnings ESP Filter, Premium Screener and more, as part of Zacks Premium. Gain full access now >>
Zacks ECAP Stocks Fiserv & Oracle Corporation Make Significant Gains
Fiserv, Inc. FI, a component of our Earnings Certain Admiral Portfolio (ECAP), has jumped 19.2% over the past 12 weeks. Oracle Corporation ORCL has followed Fiserv with 19% returns.
ECAP, which consists of 30 concentrated, ultra-defensive, long-term Buy and Hold stocks, has returned +9.08% in the year-to-date period (through March 31, 2024) vs. +10.42%.
In 2023, the portfolio returned +12.17% vs. +26.28% for the S&P 500 index. The portfolio returned -4.7% in 2022 vs. the S&P 500 index’s -17.96%.
With little to no turnover and annual rebalance periodicity, ECAP seeks to minimize capital loss by holding shares of companies whose earnings streams exhibit a proven 20+ year track record of surviving recessionary periods with minimal impact on aggregate earnings growth relative to the overall S&P 500.
The ECAP and many other model portfolios are available as part of Zacks Advisor Tools, a cloud-based solution to access Zacks award-winning stock, mutual fund and ETF research. Click here to schedule a demo.
Zacks ECDP Stocks Public Storage and American Tower Outperform Peers
Public Storage PSA, which is part of our Earnings Certain Dividend Portfolio (ECDP), has returned 25.8% over the past 12 weeks. Another ECDP stock, American Tower Corporation AMT, has also climbed 20.9% over the same time frame. Of course, the inclination of investors toward quality dividend stocks to secure an income stream amid heightened market volatility contributed to this performance.
Check Public Storage’s dividend history here>>>
Check American Tower’s dividend history here>>>
With an extremely low beta and a history of minimum earnings variability over the last 20+ years, this 25-stock portfolio helps significantly mitigate risk.
ECDP has returned +4.47% in the year-to-date period (through March 31, 2024) vs. +10.42% for the S&P 500 index (IVV) and +6.9% for the Dividend Aristocrats ETF (NOBL).
The portfolio returned -0.9% in 2023 vs. +26.28% for the S&P 500 index and +8.11% for NOBL. The portfolio returned -2.3% in 2022 vs. -17.96% for the S&P 500 index and -8.34% for NOBL.
Click here to access this portfolio on Zacks Advisor Tools.
Zacks Top 10 Stocks Ollie's Bargain Delivers Solid Returns
Ollie's Bargain Outlet Holdings, Inc. OLLI, from the Zacks Top 10 Stocks for 2024, has jumped 30.4% year to date, which compares to the S&P 500 index’s +20% increase.
The Top 10 portfolio returned +19.56% in 2024 Q1 vs. +10.56% for the S&P 500 index and +7.9% for the equal-weight version of the index.
The Top 10 portfolio returned +25.15% in 2023 vs. +26.28% for the S&P 500 index. Since 2012, the Top 10 portfolio has produced a cumulative return of +1,060.9% through the end of 2023 vs. +360.1% for the S&P 500 index.
Since 2012, the Zacks Top 10 portfolio has produced an annualized return of +25.02% through the end of 2024 Q1 vs. +14.1% for the S&P 500 index and +12.7% for the equal-weight version of the index. The portfolio has produced a cumulative return of +1,442.3% vs. +403.03% for the S&P 500 index and +331.29% for the equal-weight index.
Want the latest recommendations from Zacks Investment Research? Today, you can download 7 Best Stocks for the Next 30 Days. Click to get this free report
American Tower Corporation (AMT) : Free Stock Analysis Report
Public Storage (PSA) : Free Stock Analysis Report
PulteGroup, Inc. (PHM) : Free Stock Analysis Report
Oracle Corporation (ORCL) : Free Stock Analysis Report
Phibro Animal Health Corporation (PAHC) : Free Stock Analysis Report
Fiserv, Inc. (FI) : Free Stock Analysis Report
Ollie's Bargain Outlet Holdings, Inc. (OLLI) : Free Stock Analysis Report
Axon Enterprise, Inc (AXON) : Free Stock Analysis Report
ProShares S&P 500 Dividend Aristocrats ETF (NOBL): ETF Research Reports
SB Financial Group, Inc. (SBFG) : Free Stock Analysis Report
Travelzoo (TZOO) : Free Stock Analysis Report
Solventum Corporation (SOLV) : Free Stock Analysis Report