
 Yahoo Finance
 Zapf Creation (MUN:ZPF) Could Be Struggling To Allocate Capital
There are a few key trends to look for if we want to identify the next multi-bagger. Typically, we'll want to notice a trend of growing return on capital employed (ROCE) and alongside that, an expanding base of capital employed. Ultimately, this demonstrates that it's a business that is reinvesting profits at increasing rates of return. In light of that, when we looked at Zapf Creation (MUN:ZPF) and its ROCE trend, we weren't exactly thrilled.
What Is Return On Capital Employed (ROCE)?
Just to clarify if you're unsure, ROCE is a metric for evaluating how much pre-tax income (in percentage terms) a company earns on the capital invested in its business. Analysts use this formula to calculate it for Zapf Creation:
Return on Capital Employed = Earnings Before Interest and Tax (EBIT) ÷ (Total Assets - Current Liabilities)
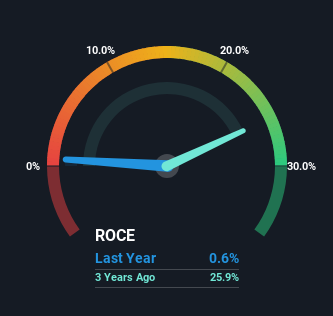
0.0061 = €543k ÷ (€107m - €18m) (Based on the trailing twelve months to December 2022).
So, Zapf Creation has an ROCE of 0.6%. In absolute terms, that's a low return and it also under-performs the Leisure industry average of 17%.
View our latest analysis for Zapf Creation
While the past is not representative of the future, it can be helpful to know how a company has performed historically, which is why we have this chart above. If you want to delve into the historical earnings, revenue and cash flow of Zapf Creation, check out these free graphs here.
What Can We Tell From Zapf Creation's ROCE Trend?
On the surface, the trend of ROCE at Zapf Creation doesn't inspire confidence. Around five years ago the returns on capital were 36%, but since then they've fallen to 0.6%. And considering revenue has dropped while employing more capital, we'd be cautious. This could mean that the business is losing its competitive advantage or market share, because while more money is being put into ventures, it's actually producing a lower return - "less bang for their buck" per se.
On a related note, Zapf Creation has decreased its current liabilities to 17% of total assets. That could partly explain why the ROCE has dropped. What's more, this can reduce some aspects of risk to the business because now the company's suppliers or short-term creditors are funding less of its operations. Some would claim this reduces the business' efficiency at generating ROCE since it is now funding more of the operations with its own money.
Our Take On Zapf Creation's ROCE
In summary, we're somewhat concerned by Zapf Creation's diminishing returns on increasing amounts of capital. And long term shareholders have watched their investments stay flat over the last three years. That being the case, unless the underlying trends revert to a more positive trajectory, we'd consider looking elsewhere.
One final note, you should learn about the 3 warning signs we've spotted with Zapf Creation (including 2 which make us uncomfortable) .
If you want to search for solid companies with great earnings, check out this free list of companies with good balance sheets and impressive returns on equity.
Have feedback on this article? Concerned about the content? Get in touch with us directly. Alternatively, email editorial-team (at) simplywallst.com.
This article by Simply Wall St is general in nature. We provide commentary based on historical data and analyst forecasts only using an unbiased methodology and our articles are not intended to be financial advice. It does not constitute a recommendation to buy or sell any stock, and does not take account of your objectives, or your financial situation. We aim to bring you long-term focused analysis driven by fundamental data. Note that our analysis may not factor in the latest price-sensitive company announcements or qualitative material. Simply Wall St has no position in any stocks mentioned.
