
 Yahoo Finance
 Zogenix, Inc.'s (NASDAQ:ZGNX) Shift From Loss To Profit

Want to participate in a short research study? Help shape the future of investing tools and you could win a $250 gift card!
Zogenix, Inc.'s (NASDAQ:ZGNX): Zogenix, Inc., a pharmaceutical company, develops and commercializes therapies for the treatment of transformative central nervous system disorders in the United States. The US$1.7b market-cap posted a loss in its most recent financial year of -US$123.7m and a latest trailing-twelve-month loss of -US$128.7m leading to an even wider gap between loss and breakeven. Many investors are wondering the rate at which ZGNX will turn a profit, with the big question being “when will the company breakeven?” I’ve put together a brief outline of industry analyst expectations for ZGNX, its year of breakeven and its implied growth rate.
See our latest analysis for Zogenix
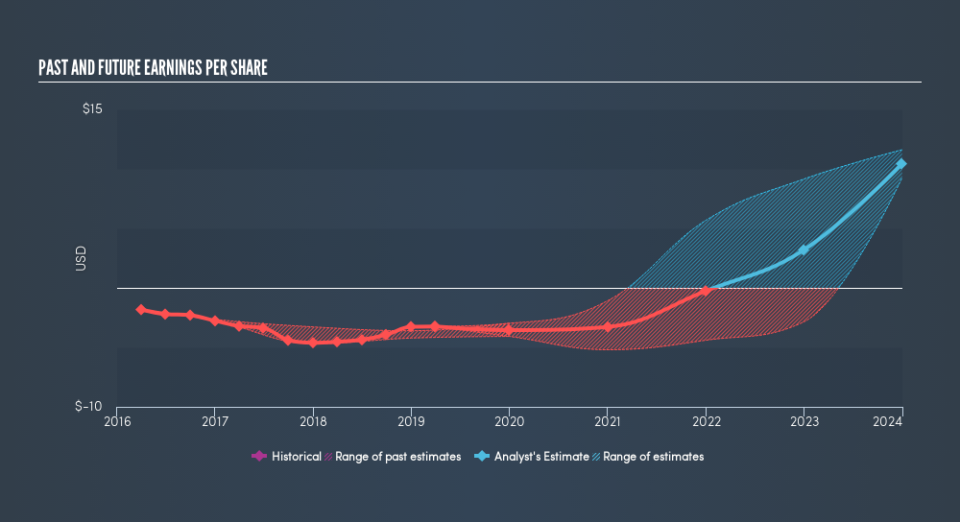
Consensus from the 10 Pharmaceuticals analysts is ZGNX is on the verge of breakeven. They anticipate the company to incur a final loss in 2021, before generating positive profits of US$158m in 2022. So, ZGNX is predicted to breakeven approximately 3 years from today. In order to meet this breakeven date, I calculated the rate at which ZGNX must grow year-on-year. It turns out an average annual growth rate of 70% is expected, which signals high confidence from analysts. Should the business grow at a slower rate, it will become profitable at a later date than expected.
I’m not going to go through company-specific developments for ZGNX given that this is a high-level summary, though, take into account that typically a pharma company has lumpy cash flows which are contingent on the drug and stage of product development the business is in. So, a high growth rate is not out of the ordinary, particularly when a company is in a period of investment.
Before I wrap up, there’s one aspect worth mentioning. ZGNX currently has no debt on its balance sheet, which is rare for a loss-making pharma, which typically has high debt relative to its equity. This means that ZGNX has been operating purely on its equity investment and has no debt burden. This aspect reduces the risk around investing in the loss-making company.
Next Steps:
There are key fundamentals of ZGNX which are not covered in this article, but I must stress again that this is merely a basic overview. For a more comprehensive look at ZGNX, take a look at ZGNX’s company page on Simply Wall St. I’ve also compiled a list of important aspects you should look at:
Valuation: What is ZGNX worth today? Has the future growth potential already been factored into the price? The intrinsic value infographic in our free research report helps visualize whether ZGNX is currently mispriced by the market.
Management Team: An experienced management team on the helm increases our confidence in the business – take a look at who sits on Zogenix’s board and the CEO’s back ground.
Other High-Performing Stocks: Are there other stocks that provide better prospects with proven track records? Explore our free list of these great stocks here.
We aim to bring you long-term focused research analysis driven by fundamental data. Note that our analysis may not factor in the latest price-sensitive company announcements or qualitative material.
If you spot an error that warrants correction, please contact the editor at editorial-team@simplywallst.com. This article by Simply Wall St is general in nature. It does not constitute a recommendation to buy or sell any stock, and does not take account of your objectives, or your financial situation. Simply Wall St has no position in the stocks mentioned. Thank you for reading.
