
 Yahoo Finance
 Zooming in on LON:DVO's 5.7% Dividend Yield

Could Devro plc (LON:DVO) be an attractive dividend share to own for the long haul? Investors are often drawn to strong companies with the idea of reinvesting the dividends. Yet sometimes, investors buy a popular dividend stock because of its yield, and then lose money if the company's dividend doesn't live up to expectations.
With Devro yielding 5.7% and having paid a dividend for over 10 years, many investors likely find the company quite interesting. It would not be a surprise to discover that many investors buy it for the dividends. Before you buy any stock for its dividend however, you should always remember Warren Buffett's two rules: 1) Don't lose money, and 2) Remember rule #1. We'll run through some checks below to help with this.
Click the interactive chart for our full dividend analysis
Payout ratios
Dividends are usually paid out of company earnings. If a company is paying more than it earns, then the dividend might become unsustainable - hardly an ideal situation. Comparing dividend payments to a company's net profit after tax is a simple way of reality-checking whether a dividend is sustainable. Looking at the data, we can see that 98% of Devro's profits were paid out as dividends in the last 12 months. With a payout ratio this high, we'd say its dividend is not well covered by earnings. This may be fine if earnings are growing, but it might not take much of a downturn for the dividend to come under pressure.
We also measure dividends paid against a company's levered free cash flow, to see if enough cash was generated to cover the dividend. Devro paid out 90% of its free cash last year. Cash flows can be lumpy, but this dividend was not well covered by cash flow. Cash is slightly more important than profit from a dividend perspective, but given Devro's payouts were not well covered by either earnings or cash flow, we would definitely be concerned about the sustainability of this dividend.
Is Devro's Balance Sheet Risky?
As Devro's dividend was not well covered by earnings, we need to check its balance sheet for signs of financial distress. A rough way to check this is with these two simple ratios: a) net debt divided by EBITDA (earnings before interest, tax, depreciation and amortisation), and b) net interest cover. Net debt to EBITDA is a measure of a company's total debt. Net interest cover measures the ability to meet interest payments. Essentially we check that a) the company does not have too much debt, and b) that it can afford to pay the interest. With net debt of 2.37 times its EBITDA, Devro's debt burden is within a normal range for most listed companies.
Net interest cover can be calculated by dividing earnings before interest and tax (EBIT) by the company's net interest expense. Net interest cover of 6.42 times its interest expense appears reasonable for Devro, although we're conscious that even high interest cover doesn't make a company bulletproof.
Consider getting our latest analysis on Devro's financial position here.
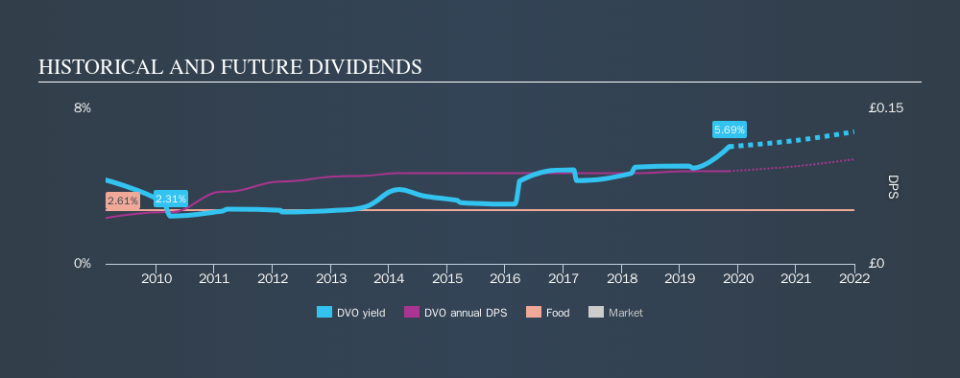
Dividend Volatility
Before buying a stock for its income, we want to see if the dividends have been stable in the past, and if the company has a track record of maintaining its dividend. For the purpose of this article, we only scrutinise the last decade of Devro's dividend payments. During this period the dividend has been stable, which could imply the business could have relatively consistent earnings power. During the past ten-year period, the first annual payment was UK£0.044 in 2009, compared to UK£0.09 last year. This works out to be a compound annual growth rate (CAGR) of approximately 7.3% a year over that time.
Companies like this, growing their dividend at a decent rate, can be very valuable over the long term, if the rate of growth can be maintained.
Dividend Growth Potential
Dividend payments have been consistent over the past few years, but we should always check if earnings per share (EPS) are growing, as this will help maintain the purchasing power of the dividend. Devro's EPS have fallen by approximately 15% per year. A sharp decline in earnings per share is not great from from a dividend perspective, as even conservative payout ratios can come under pressure if earnings fall far enough.
Conclusion
When we look at a dividend stock, we need to form a judgement on whether the dividend will grow, if the company is able to maintain it in a wide range of economic circumstances, and if the dividend payout is sustainable. We're a bit uncomfortable with Devro paying out a high percentage of both its cashflow and earnings. Moreover, earnings have been shrinking. While the dividends have been fairly steady, we'd wonder for how much longer this will be sustainable if earnings continue to decline. There are a few too many issues for us to get comfortable with Devro from a dividend perspective. Businesses can change, but we would struggle to identify why an investor should rely on this stock for their income.
Without at least some growth in earnings per share over time, the dividend will eventually come under pressure either from costs or inflation. See if the 5 analysts are forecasting a turnaround in our free collection of analyst estimates here.
We have also put together a list of global stocks with a market capitalisation above $1bn and yielding more 3%.
We aim to bring you long-term focused research analysis driven by fundamental data. Note that our analysis may not factor in the latest price-sensitive company announcements or qualitative material.
If you spot an error that warrants correction, please contact the editor at editorial-team@simplywallst.com. This article by Simply Wall St is general in nature. It does not constitute a recommendation to buy or sell any stock, and does not take account of your objectives, or your financial situation. Simply Wall St has no position in the stocks mentioned. Thank you for reading.
