Arthur J. Gallagher & Co. (0ITL.L)
| Previous close | 236.34 |
| Open | 246.10 |
| Bid | 0.00 x 0 |
| Ask | 0.00 x 0 |
| Day's range | 246.10 - 246.10 |
| 52-week range | 179.92 - 255.68 |
| Volume | |
| Avg. volume | 2,970 |
| Market cap | 450.543M |
| Beta (5Y monthly) | N/A |
| PE ratio (TTM) | 0.54 |
| EPS (TTM) | 4.56 |
| Earnings date | 25 Jul 2024 - 29 Jul 2024 |
| Forward dividend & yield | N/A (N/A) |
| Ex-dividend date | N/A |
| 1y target est | N/A |
 Zacks
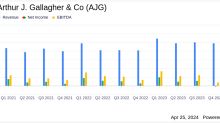
ZacksArthur J. Gallagher (AJG) Q1 Earnings: Taking a Look at Key Metrics Versus Estimates
The headline numbers for Arthur J. Gallagher (AJG) give insight into how the company performed in the quarter ended March 2024, but it may be worthwhile to compare some of its key metrics to Wall Street estimates and the year-ago actuals.
 GuruFocus.com
Arthur J. Gallagher & Co. Reports First Quarter 2024 Earnings, Surpasses Analyst Expectations
Comprehensive Analysis of AJG's Financial Performance and Strategic Positioning
 PR Newswire
Arthur J. Gallagher & Co. Announces First Quarter 2024 Financial Results
Arthur J. Gallagher & Co. (NYSE: AJG) today reported its financial results for the quarter ended March 31, 2024. Management will host a webcast conference call to discuss these results on Thursday, April 25, 2024 at 5:15 p.m. ET/4:15 p.m. CT. To listen to the call, and for printer-friendly formats of this release and the "CFO Commentary" and "Supplemental Quarterly Data," which may also be referenced during the call, please visit ajg.com/IR. These documents contain both GAAP and non-GAAP measure