Hancock Horizon Quant Long/Short Inv (HHQAX)
Nasdaq - Nasdaq Delayed price. Currency in USD
Add to watchlist
As of 09:00PM EDT. Market open.
Hancock Horizon Quant Long/Short Inv
Advisors Inner Circle Fund II
One Freedom Valley Drive
Oaks PA 19456
888-422-2654
Management information
Paula Chastain,Lead manager since 29 September 2008
Paula Chastain serves as a portfolio manager for Horizon Advisers. Ms. Chastain began working for Horizon in 1996 and has been working in the investment industry since 1996.
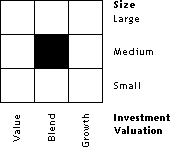
Morningstar style box
Yahoo partners with Morningstar, a leading market research and investment data group to help investors rate and compare funds on Yahoo Finance. The Morningstar Category is shown next to the Morningstar Style Box, which identifies a fund's investment focus, based on the underlying securities in the fund.
Morningstar category
While the investment objective stated in a fund's prospectus may or may not reflect how the fund actually invests, the Morningstar category is assigned based on the underlying securities in each portfolio. Morningstar categories help investors and investment professionals make meaningful comparisons between funds. The categories make it easier to build well-diversified portfolios, assess potential risk and identify top-performing funds. We place funds in a given category based on their portfolio statistics and compositions over the past three years. If the fund is new and has no portfolio history, we estimate where it will fall before giving it a more permanent category assignment. Where necessary, we may change a category assignment based on recent changes to the portfolio.
Fund overview
CategoryLong-Short Equity
Fund familyHancock Horizon
Net assets82.23M
YTD return19.11%
Yield0.00%
Morningstar rating★★★
Inception date29 Sept 2008
Fund operations
Last dividend0.09
Last cap gain0.00
Holdings turnover74.00%
Average for categoryN/A
Fees and expenses
ExpenseHHQAXCategory average
Annual report expense ratio (net)1.66%1.92%
Prospectus net expense ratio1.66%N/A
Prospectus gross expense ratio1.66%N/A
Max 12b1 feeN/AN/A
Max front end sales loadN/A5.33%
Max deferred sales loadN/A1.14%
3-yr expense projection523N/A
5-yr expense projection902N/A
10-yr expense projection1,965N/A
© 2024 Yahoo. All rights reserved.