
 Yahoo Finance
 10 Cities Where Bad Drivers Are Costing You Money
Have you ever been nervous on a plane and had someone tell you that you’re much more likely to get into a car accident than a plane crash? This is inarguably true, but it doesn’t highlight just how dangerous life on the roads can be. In 2020, there were 5,250,873 police-reported car accidents, according to the NHTSA. That amounts to about 14,386 accidents per day — one car crash every six minutes.
Even if you’re lucky enough to emerge from a car crash unscathed, an accident is often a huge and expensive hassle. It could lead to pricey repairs, increased auto insurance rates or even a costly lawsuit.
Though this isn’t a local problem — car crashes happen pretty much everywhere there are cars and people to drive them — some cities are more infamous for bad drivers than others. As such, these cities see more car accidents than others.
Discover More: I Have Driven Over 250 Car Models: These Are the 3 Best and Worst for Your Money
Find Out: How To Get $340 Per Year Cash Back on Gas and Other Things You Already Buy
Forbes Advisor published a study earlier this year that identified the 10 cities in the U.S. with the worst drivers. Forbes Advisor used metrics from the National Highway Traffic Safety Administration’s Fatality and Injury Reporting System Tool.
Here’s a look at the 10 U.S. cities with the worst drivers. Is yours on the list?
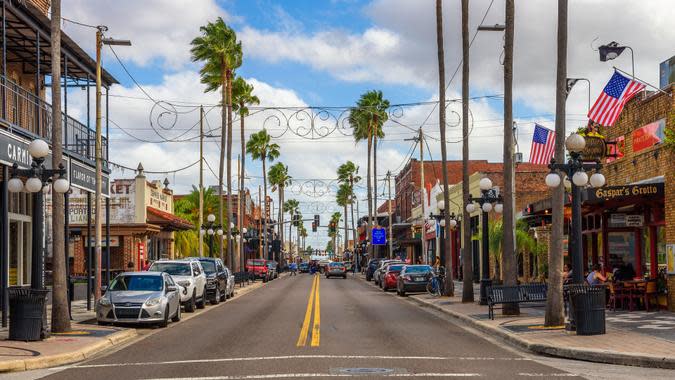
Tampa, Florida
Number of fatal car crashes from 2017 to 2021, per 100,000 residents: 15.42
Total crashes: 14.47
Crashes involving a drink driver: 3.37
Crashes involving a distracted driver: 0.75
Crashes involving speeding: 3.06
Total score out of 100 (100 being the worst): 77.13
Check Out: 6 Car Brands With Reliable Used Cars
Be Aware: 6 Hybrid Vehicles To Stay Away From Buying
Wealthy people know the best money secrets. Learn how to copy them.
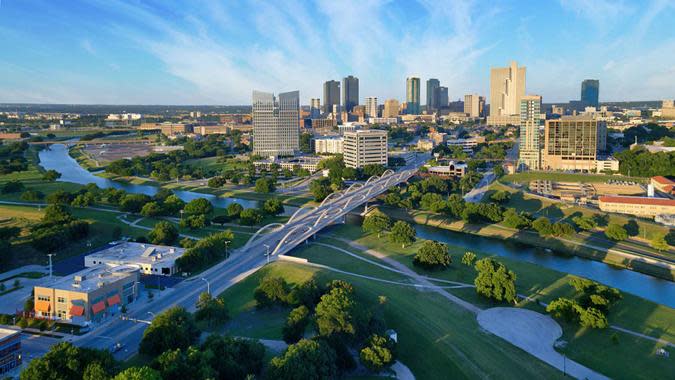
Fort Worth, Texas
Number of fatal car crashes from 2017 to 2021, per 100,000 residents: 11.48
Total crashes: 10.60
Crashes involving a drink driver: 4.70
Crashes involving a distracted driver: 0.92
Crashes involving speeding: 3.68
Total score out of 100: 78.03
Read Next: 4 Cars That Cost More Used Than New
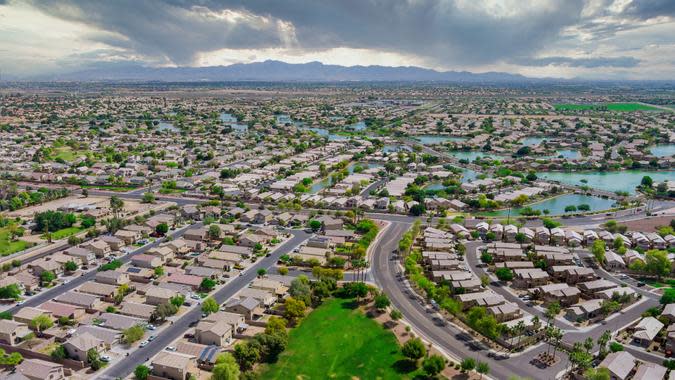
Phoenix
Number of fatal car crashes from 2017 to 2021, per 100,000 residents: 14.59
Total crashes: 13.85
Crashes involving a drink driver: 3.93
Crashes involving a distracted driver: 0.71
Crashes involving speeding: 3.86
Total score out of 100: 80.65
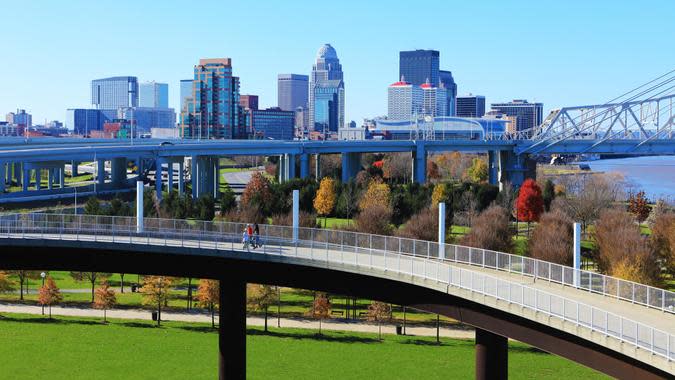
Louisville, Kentucky
Number of fatal car crashes from 2017 to 2021, per 100,000 residents: 14.99
Total crashes: 14.25
Crashes involving a drink driver: 3.88
Crashes involving a distracted driver: 1.47
Crashes involving speeding: 3.17
Total score out of 100: 83.88
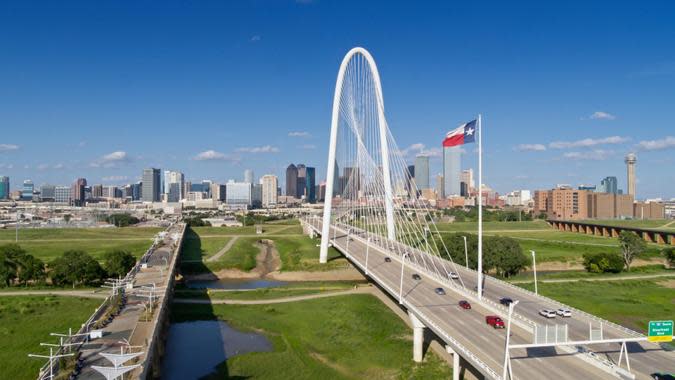
Dallas
Number of fatal car crashes from 2017 to 2021, per 100,000 residents: 15.77
Total crashes: 14.61
Crashes involving a drink driver: 6.25
Crashes involving a distracted driver: 0.69
Crashes involving speeding: 5.69
Total score out of 100: 90.97
Explore More: 4 Affordable Car Brands You Won’t Regret Buying in 2024
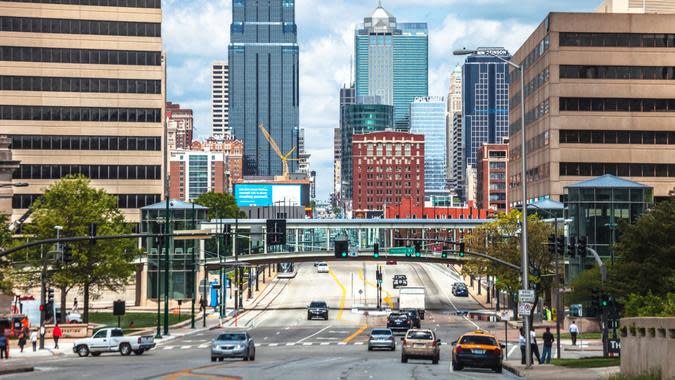
Kansas City, Missouri
Number of fatal car crashes from 2017 to 2021, per 100,000 residents: 16.85
Total crashes: 15.71
Crashes involving a drink driver: 5.34
Crashes involving a distracted driver: 0.51
Crashes involving speeding: 7.07
Total score out of 100: 91.19
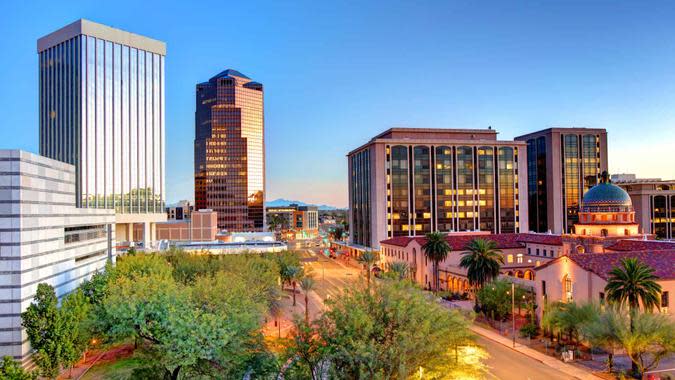
Tucson, Arizona
Number of fatal car crashes from 2017 to 2021, per 100,000 residents: 17.02
Total crashes: 16.21
Crashes involving a drink driver: 4.35
Crashes involving a distracted driver: 1.10
Crashes involving speeding: 4.94
Total score out of 100: 93.02
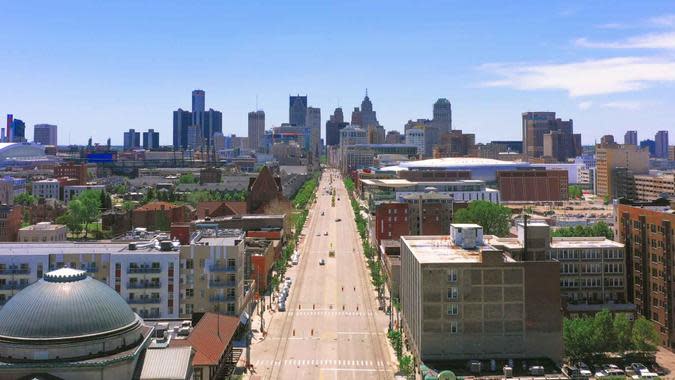
Detroit
Number of fatal car crashes from 2017 to 2021, per 100,000 residents: 21.47
Total crashes: 19.76
Crashes involving a drink driver: 6.54
Crashes involving a distracted driver: 0.55
Crashes involving speeding: 6.80
Total score out of 100: 94.97
Read Next: 8 Best Luxury Cars for Wealthy Retirees

Memphis, Tennessee
Number of fatal car crashes from 2017 to 2021, per 100,000 residents: 25.96
Total crashes: 24.18
Crashes involving a drink driver: 7.50
Crashes involving a distracted driver: 1.35
Crashes involving speeding: 3.74
Total score out of 100: 98.51
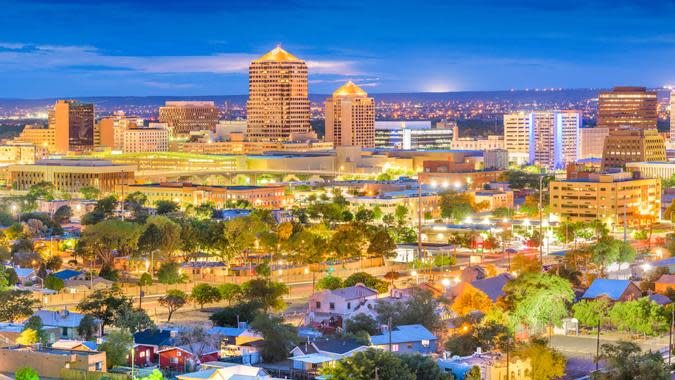
Albuquerque, New Mexico
Number of fatal car crashes from 2017 to 2021, per 100,000 residents: 18.11
Total crashes: 17.11
Crashes involving a drink driver: 4.67
Crashes involving a distracted driver: 5.42
Crashes involving speeding: 5.56
Total score out of 100: 100.00
More From GOBankingRates
6 Things to Try This Week if You're Behind on Your Savings Goals
4 Reasons Retired Women Need More Money Than Men -- And What To Do About it
This article originally appeared on GOBankingRates.com: 10 Cities Where Bad Drivers Are Costing You Money
